
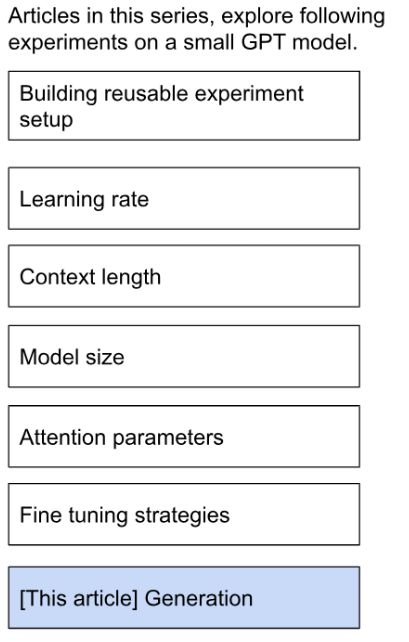
Experiments with temperature, greedy decoding, top-k, and top-p to understand the trade-offs between predictability, repetition, coherence, and creativity.
A GPT model does not directly choose its next word. More precisely, it assigns probabilities to thousands of possible next tokens.
Decoding is the step that converts those probabilities into an actual token.
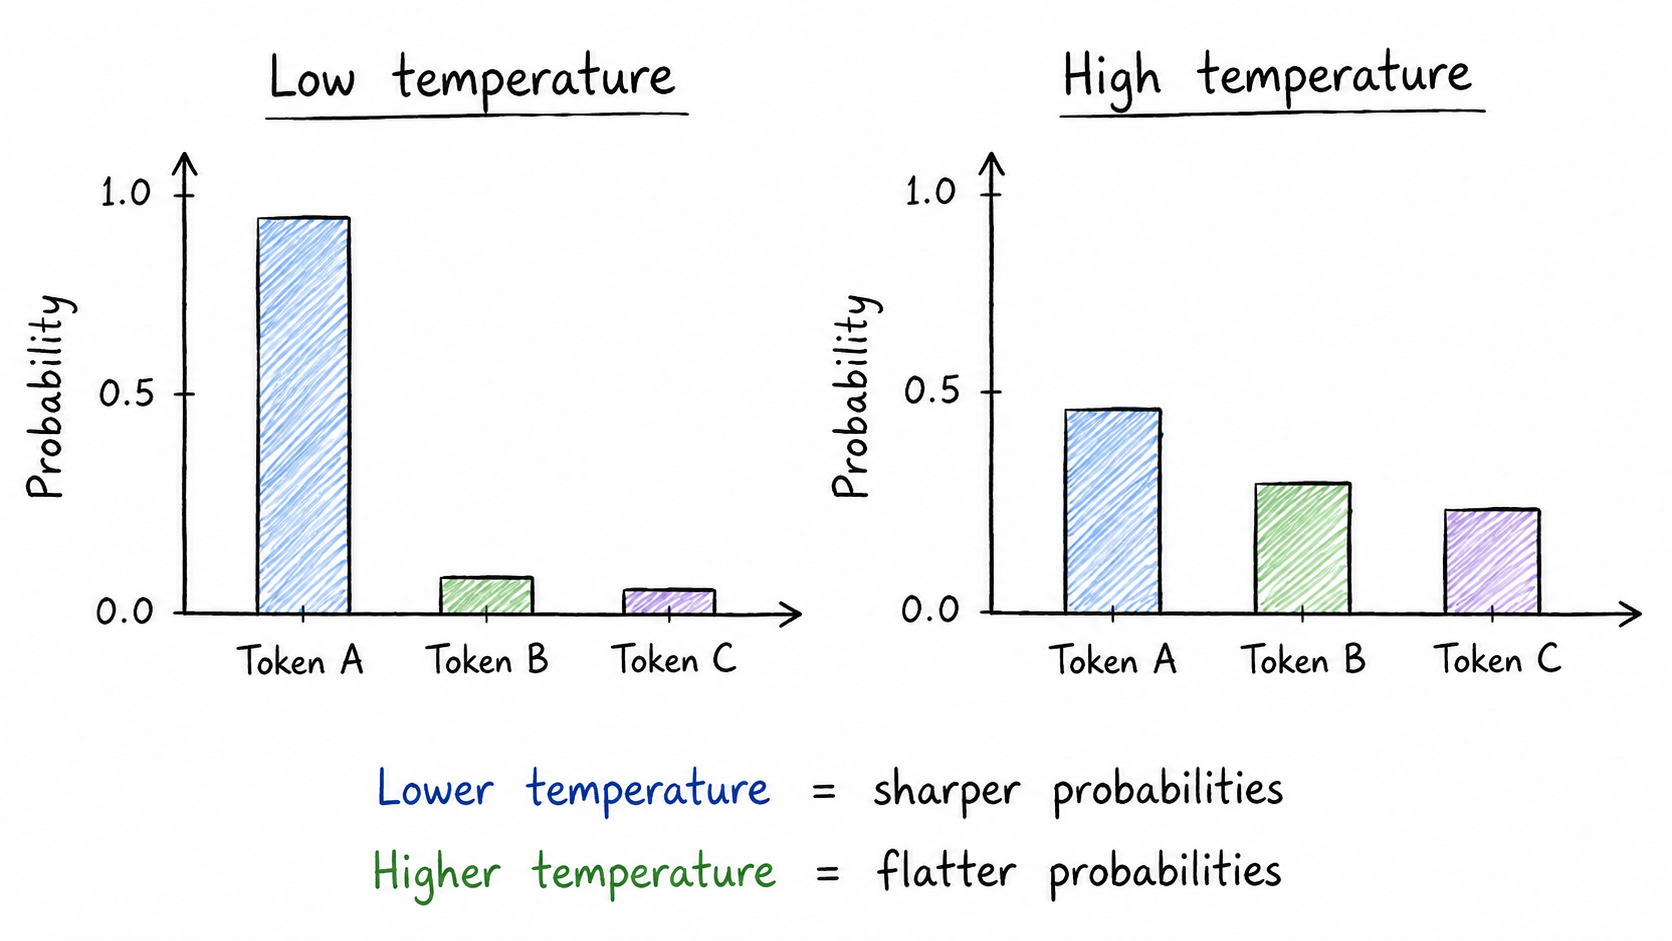
Temperature is one of the controls used during decoding. A lower temperature concentrates probability around the model’s favorite choices—the output becomes more “frozen.” A higher temperature spreads probability across more alternatives, increasing uncertainty and potential variety.
However, temperature does not always change the generated text. If we use greedy decoding, which always selects the highest-scoring token, every positive temperature produces the same choice. Temperature matters when the decoding strategy actually samples from the probability distribution.
I explored this through two experiments:
Temperature and test behavior: Does temperature affect predictable and diverse datasets differently? I measured test loss, sampled next-token accuracy, and entropy.
Generation strategies: How do greedy decoding, unrestricted sampling, top-k, and top-p change repetition, diversity, coherence, and creativity?
In the first experiment, both low- and high-diversity test sets achieved their lowest test loss at T = 1.0. Lower temperatures made sampling more predictable, but they also made the model too confident when it was wrong. Higher temperatures increased uncertainty while sampled accuracy fell sharply.
In the second experiment, greedy decoding was the most predictable but also the most repetitive. Unrestricted sampling produced the widest variation but was less reliable. Top-k and top-p offered more controlled exploration, with top-p showing the strongest overall balance in this setup.
The code is available in my GitHub repository.
Suppose the model is continuing:
The capital of France is
It may assign the highest probability to Paris, while still keeping other tokens in consideration:
| Possible token | Probability |
|---|---|
| Paris | 90% |
| in | 5% |
| city | 5% |
A decoding strategy decides what happens next:
Greedy: always choose the highest-probability token.
Unrestricted sampling: randomly sample from the complete distribution.
Top-k: remove all but the k most likely tokens, then sample.
Top-p: keep the smallest set of tokens whose combined probability crosses a chosen threshold, then sample.
Sampling is random, but it is not uniformly random. A token with 30% probability is still much more likely to be selected than one with 2%.
These choices are repeated for every generated token. A small difference at one step can therefore send the continuation in a completely different direction.
Temperature rescales the model’s logits before converting them into probabilities:
scaled_logits = logits / temperature
Consider three possible tokens with logits of 2, 1, and 0.
| Temperature | Paris | in | city |
|---|---|---|---|
| 0.5 | 86.7% | 11.7% | 1.6% |
| 1.0 | 66.5% | 24.5% | 9.0% |
| 2.0 | 50.6% | 30.7% | 18.6% |
At T = 0.5, Paris dominates. At T = 2.0, the alternatives receive much more probability.
However, Paris remains the most likely token at every temperature.
That leads to an important distinction:
Temperature does not change positive-temperature greedy decoding because the ranking of tokens remains the same.
It does affect probability-based strategies:
With unrestricted sampling, it changes each token’s chance of being selected.
With top-k, it changes probabilities within the retained candidate set.
With top-p, it can also change which tokens enter the candidate set because cumulative probabilities change.
For this experiment, I trained a fresh small GPT model on a balanced mixture of two datasets:
Low-diversity text: narrower topics, repeated patterns, and fewer likely continuations.
High-diversity text: broader topics and vocabulary, with more plausible next-token alternatives.
My intuition was that predictable text might benefit from a lower temperature. If one token is usually clearly correct, sharpening the distribution could help.
For diverse text, several next tokens may be reasonable. I expected it to prefer a temperature closer to 1.0, or possibly slightly above it, so that probability remained distributed across alternatives.
I tested:
temperatures = [0.3, 0.5, 0.7, 0.9, 1.0, 1.2, 1.5, 2.0]
Test loss measures how well the complete probability distribution matches the actual next tokens.
Lower is better.
Unlike accuracy, it also considers confidence. A model that is confidently wrong receives a much larger penalty than one that leaves some probability on the correct token.
I sampled a token from the temperature-adjusted distribution and measured how often it matched the actual next token.
Higher is better when predictability is the objective.
However, this metric naturally favors conservative distributions. It does not tell us whether alternative generations are interesting or coherent.
Entropy measures how spread out the probability distribution is.
Low entropy: probability is concentrated on a few tokens.
High entropy: probability is spread across many alternatives.
Neither is universally better. Low entropy is useful when predictable output matters. Higher entropy enables exploration, but too much can make the output feel random.
Argmax accuracy measures how often the model’s highest-scoring token is correct.
Higher is better.
I used it as a control rather than a primary metric. Temperature changes confidence, but not token ranking, so argmax accuracy should remain constant across positive temperatures.
Both datasets produced almost identical U-shaped loss curves.
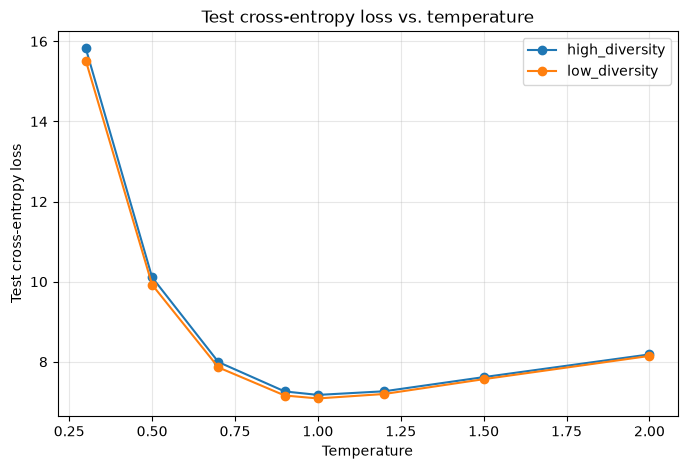
At very low temperatures, the model became too confident. When its preferred token was wrong, the correct token received almost no probability, causing test loss to rise sharply.
At high temperatures, probability was spread too widely across unlikely tokens.
The original distribution at T = 1.0 provided the best balance for both datasets.
My hypothesis that low-diversity text would prefer a lower temperature was therefore not supported. The two datasets behaved much more similarly than I expected.
As temperature increased, entropy rose and sampled accuracy fell.
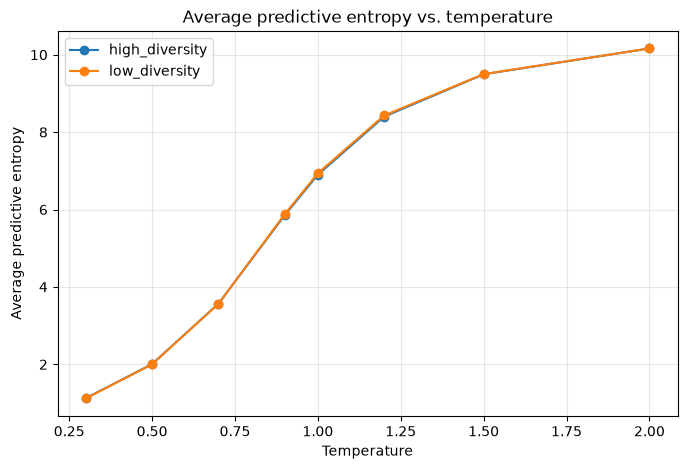
Lower temperature made sampling more predictable. Higher temperature created more possible paths.
For the generation experiment, I used official pretrained GPT-2 124M weights.
The freshly trained model was sufficient for probability-level analysis, but it had not been trained long enough to produce meaningful text. Using pretrained weights allowed me to compare decoding strategies on more realistic continuations.
I compared four strategies:
| Strategy | How it works | Useful when |
|---|---|---|
| Greedy | Always selects the most likely token | Consistency and deterministic output matter |
| Temperature 1.0 | Samples from the complete distribution | Maximum variety matters more than reliability |
| Top-k 10 | Samples from the ten most likely tokens | Controlled, relatively safe variation |
| Top-p 0.8 | Samples from the smallest set covering 80% probability | The candidate set should adapt to model confidence |
I tested three kinds of prompts because decoding may behave differently depending on the task.
Structured prompts have a relatively narrow expected continuation. I expected greedy or top-k to work best.
Narrative prompts require coherence but still benefit from variation. I expected top-k or top-p to perform well.
Creative prompts reward novelty. I expected unrestricted sampling or top-p to gain an advantage.
A bigram is a pair of consecutive tokens.
For example:
the cat sat on the cat
contains bigrams such as the cat, cat sat, and sat on. Because the cat appears twice, the text contains a repeated bigram.
The repeated-bigram rate measures how much of the output reuses token pairs.
Lower is better when we want to avoid repetitive text.
I also measured Distinct-2, the percentage of unique bigrams.
Higher generally means more variety, although extremely high diversity can also appear in incoherent text.
Average token log probability measured how probable the selected tokens were under the model. Values closer to zero indicate more likely choices.
Finally, I used a local Phi-3 model as an LLM judge. It scored coherence, relevance, fluency, creativity, and repetition. I treated these scores as directional because the lightweight judge occasionally disagreed with obvious repetition in the text.
Greedy chose the most probable tokens, but repetition was high:
| Prompt type | Repeated bigrams |
|---|---|
| Structured | 50.4% |
| Narrative | 36.8% |
| Creative | 57.3% |
One creative continuation started reasonably but quickly became repetitive:
“The moon is a very small object, about the size of a small car. It is about the size of a small house. It is about the size of a small town…”
The text was fluent, but it followed a narrow path and repeated the same structure.
Temperature sampling at T = 1.0 produced almost entirely unique outputs, with repeated-bigram rates below 5%.
However, it also selected much lower-probability tokens and was less consistent on coherence and relevance.
For example, a continuation about the moon disappearing jumped between a book, mirrors, researchers, and a colder moon. It contained variety, but the ideas did not connect cleanly.
Unrestricted sampling was more useful for creative prompts than for structured ones.
Top-k stayed closer to the model’s likely choices while reducing repetition substantially.
Top-p dynamically adjusted its candidate set. When the model was confident, fewer tokens were eligible. When probability was spread across several alternatives, the candidate set became larger.
| Strategy | Average judge score |
|---|---|
| Top-p 0.8 | 3.04 |
| Top-k 10 | 2.96 |
| Greedy | 2.87 |
| Temperature 1.0 | 2.78 |
The differences were small, but the programmatic metrics and generated examples pointed in the same general direction: top-k and top-p offered the most useful middle ground.
[IMAGE: REPEATED BIGRAM RATE BY STRATEGY AND PROMPT TYPE]
[IMAGE: CREATIVITY AND JUDGE SCORES BY STRATEGY]
Temperature is not simply a creativity slider.
It changes how concentrated the model’s probabilities are, but its visible effect depends on the decoding strategy using those probabilities.
There was also no universal best strategy:
Greedy maximized predictability but often repeated itself.
Unrestricted sampling maximized exploration but could lose coherence.
Top-k provided conservative variation.
Top-p offered the strongest overall quality-diversity balance in this setup.
The model defines what is possible.
The decoding strategy decides which possibility we actually see.
This article also brings the current Inside GPT: Experiments and Trade-offs series to a close. Across these experiments, I moved from building a GPT model to testing how choices such as learning rate, context length, model size, fine-tuning strategy, architecture, and decoding affect its behavior. The next series will move closer to real applications. I plan to explore more application-heavy topics such as agents, tool use, retrieval, memory, evaluation, and the practical trade-offs involved in turning a language model into a useful system.
The Effect of Sampling Temperature on Problem Solving in Large Language Models
A Thorough Examination of Decoding Methods in the Era of LLMs
Turning Up the Heat: Min-p Sampling for Creative and Coherent LLM Outputs