
SVM Made Easy: How Support Vector Machines Work for Classification and Regression

As a part of our learning series, we are covering supervised learning algorithms.
Support Vector Machine (SVM) is a supervised machine learning algorithm used for classification and regression tasks. It is especially popular for binary classification problems, such as:
Spam vs. Not Spam
Cat vs. Dog
Disease vs. No Disease
At its core, SVM tries to find the best possible boundary that separates different classes in the data.
What Makes SVM Different?
Unlike many algorithms that only try to classify points correctly, SVM focuses on finding the most confident separation between classes. It does this by maximizing the margin.
Margin?
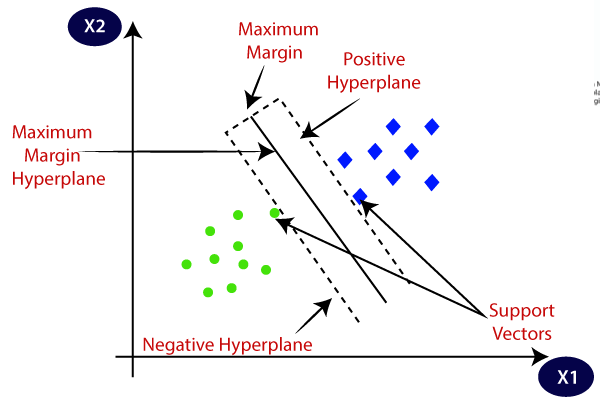
The margin is the distance between the decision boundary and the closest data points from each class.
Larger margin → better generalization
Smaller margin → higher risk of misclassification
SVM always prefers the largest possible margin.
Intuition Behind SVM (Without Math Stress)
Imagine you have two groups of points on a graph that includes Blue points → Class A and green points → Class B. You can draw many lines that separate these two classes. But SVM asks:
Which line separates them with the maximum safety gap?
That safest line is the optimal hyperplane.
Hyperplane & Support Vectors?
A hyperplane is simply a decision boundary.
In 2D → a line
In 3D → a plane
In higher dimensions → a hyperplane
The points closest to the hyperplane are called support vectors.
These points:
Decide the position of the boundary
Control the margin
It has the strongest influence on the model
Move a support vector → the boundary moves
Remove distant points → boundary stays the same
How Does SVM Classify Data?
In simple terms:
SVM looks for a boundary that separates classes
It measures distances from this boundary
It chooses the boundary with the maximum margin
New data points are classified based on which side of the boundary they fall on
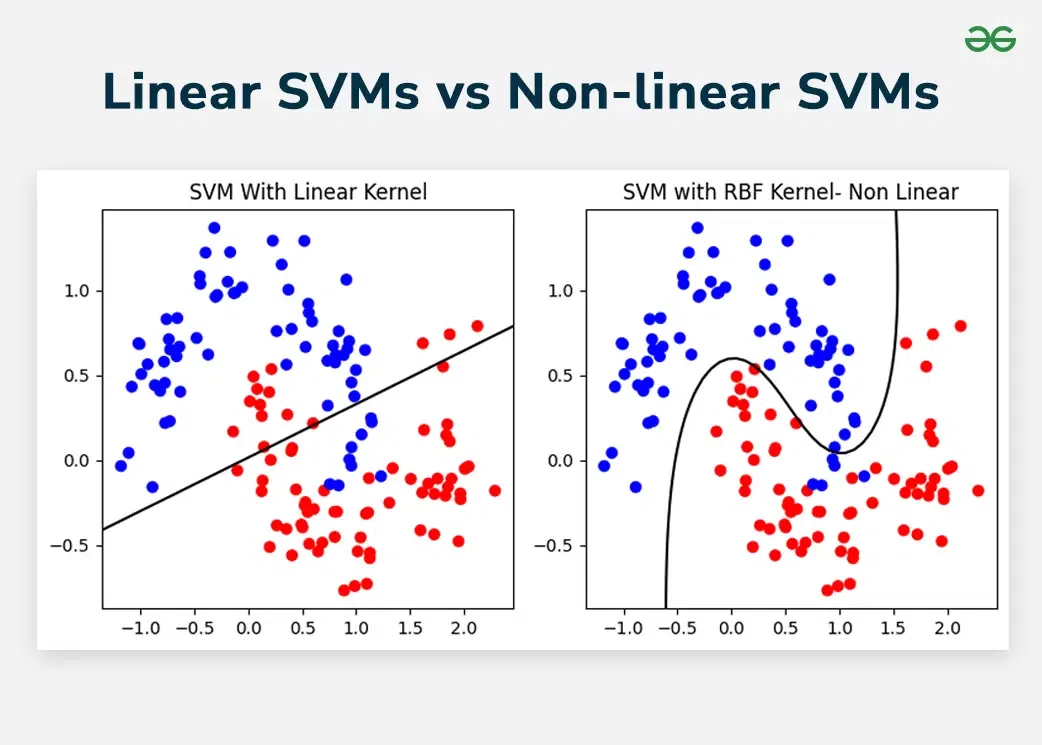
If the data can be separated by a straight line, SVM uses a Linear SVM like Exam Passed vs Failed (based on marks). But real-world data is rarely perfect. When a straight line cannot separate the data, SVM uses the Kernel Trick.
Kernels allow SVM to transform data into a higher-dimensional space where it becomes linearly separable.
SVM for Regression (SVR)
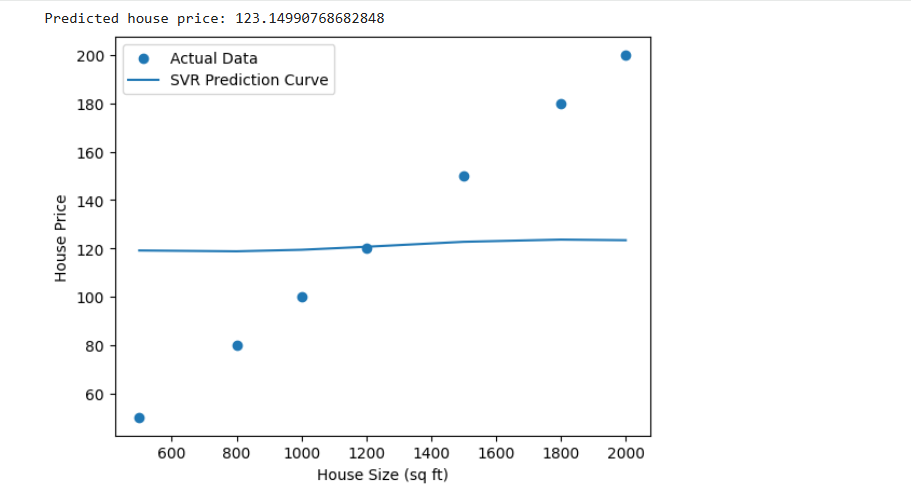
SVM can also perform regression using Support Vector Regression (SVR). The same core idea can also be extended to regression problems using Support Vector Regression (SVR). Instead of separating data into classes, SVR tries to predict continuous numerical values such as house prices, temperatures, or scores. It works by fitting a function that captures the overall trend of the data while allowing a small margin of error (called epsilon). As long as predictions fall within this acceptable range, they are not penalized, which helps the model focus on general patterns rather than noise. The final result of SVR is a precise numerical output, making SVM a powerful and flexible algorithm capable of handling both classification and regression tasks effectively.

Advantages of SVM
Works well with high-dimensional data
Effective even with small datasets
Robust to overfitting (especially with good kernels)
Strong theoretical foundation
Performs well in text and image data
Limitations of SVM
Computationally expensive for large datasets
Choosing the right kernel requires experience
Harder to interpret compared to linear models
Not ideal when classes heavily overlap
Practical Example : Predicting House Price Using SVM (Regression)
Let’s say we want to predict house prices based on house size (in square feet).This is a regression problem because the output is a number, not a class.
import numpy as np
import matplotlib.pyplot as plt
from sklearn.svm import SVR

# House size (in square feet)
X = np.array([500, 800, 1000, 1200, 1500, 1800, 2000]).reshape(-1, 1)

# Corresponding house prices (in thousands)
y = np.array([50, 80, 100, 120, 150, 180, 200])

model = SVR(kernel='rbf', epsilon=10)
model.fit(X, y)

predicted_price = model.predict([[1600]])
print("Predicted house price:", predicted_price[0])

plt.scatter(X, y, label="Actual Data")
plt.plot(X, model.predict(X), label="SVR Prediction Curve")
plt.xlabel("House Size (sq ft)")
plt.ylabel("House Price")
plt.legend()
plt.show()
Final Thoughts
Support Vector Machine is a powerful and elegant algorithm that balances theory and practice beautifully. Its ability to handle high-dimensional data, combined with the kernel trick, makes it one of the most reliable algorithms in supervised learning.
If you truly want to understand how decision boundaries work, SVM is a must-learn algorithm.
Follow for more. ML Diaries by Fahad


