
This is a submission for the GitHub Finish-Up-A-Thon Challenge
| Name | InsightTrack |
| GitHub | github.com/nishikantaray/insighttrack |
| Stack | React 18 · Vite 5 · Tailwind CSS · Express 4 · Node.js 20 · PostgreSQL · DuckDB |


InsightTrack is a self-hosted, privacy-first web analytics platform — my personal answer to the question "Why do I have to send all my users' data to Google just to know how many people visited my site?"
It tracks pageviews, sessions, conversions, user flows, and engagement — all on your own infrastructure, with no cookies and no third-party data sharing. The architecture uses PostgreSQL for all writes and DuckDB as an embedded columnar OLAP engine for analytics reads, achieving 10-100× the query speed of a traditional row-store setup.
I started InsightTrack during a long weekend when I was frustrated with the privacy implications of Google Analytics and the price tags on alternatives like Plausible and Fathom. The idea was simple: build a clean, self-hostable dashboard that you could drop a <script> tag into and be live in 5 minutes.
I got a working v1 out. It had a dashboard, auth, an onboarding wizard, basic charts, funnels, and a Docker Compose file that actually ran. Then I stopped. The project sat in a local folder for months — almost good enough, but not quite. The DuckDB sync was fragile. There was no dark mode on half the pages. Dozens of planned features were never built. Query performance fell apart past 30 days of data.
The bones were good. I just never gave it the finish it deserved.
Your Website
  └── analytics.js (tracking script, ~2 KB)
        │  POST /api/track/event
        ▼
  Express API (Node.js)
        │  Writes
        ▼
  PostgreSQL ──── Incremental sync worker (every 5 min)
                        │
                        ▼
                    DuckDB (OLAP reads)
                        │
                        ▼
  React Dashboard ◀─── GET /api/analytics/*
navigator.sendBeacon. Express validates and inserts into PostgreSQL. Response is immediate — DuckDB is never in the write path./api/track/* and /api/auth/* are public.| Table | Purpose |
|---|---|
events |
Raw event log — pageviews, clicks, custom events |
sessions |
Session metadata — duration, page count, entry/exit pages |
sites |
Registered websites and their tracking keys |
funnels |
Funnel definitions with ordered steps |
daily_stats |
Pre-aggregated daily rollups |
users |
Dashboard user accounts |
Hero

Features Grid

How It Works

Tech Stack

Comparison Table vs Google Analytics

Footer & CTA

| Login | Register |
|---|---|
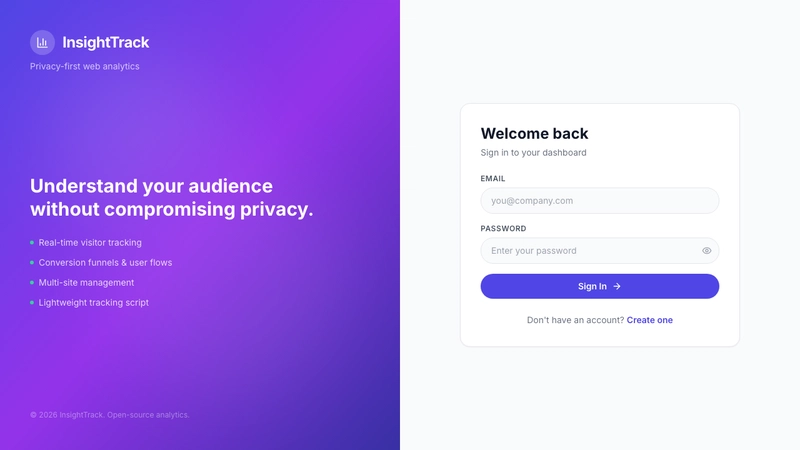 |
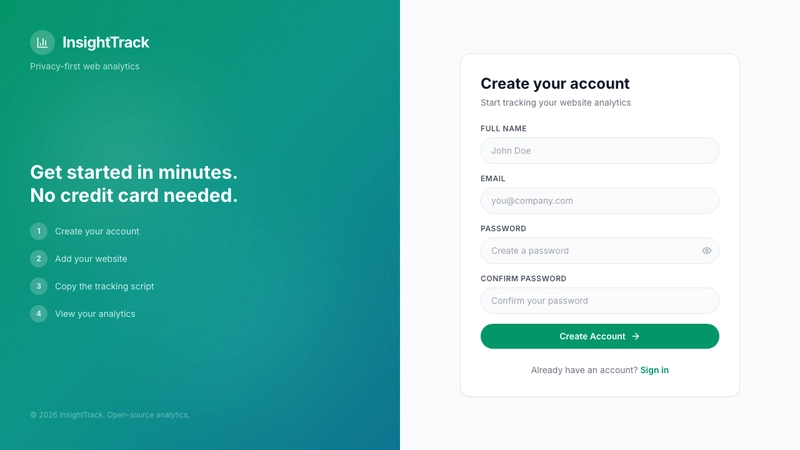 |

| Light Mode | Dark Mode |
|---|---|
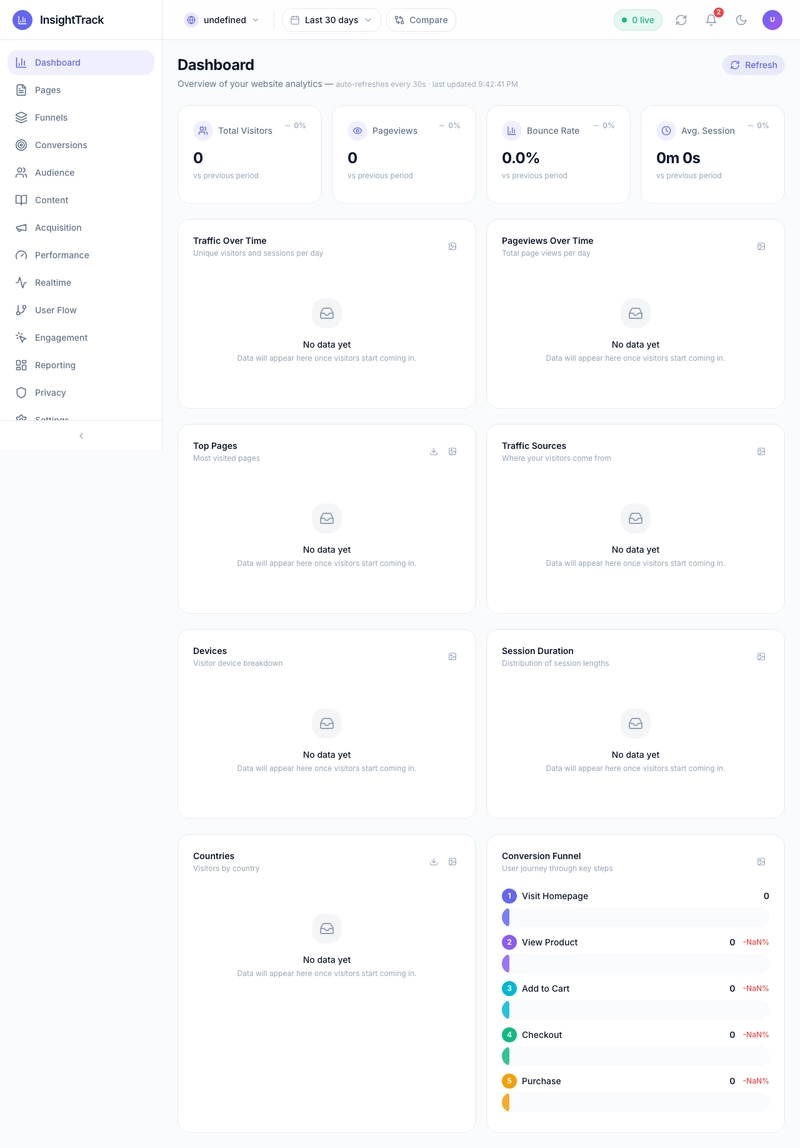 |
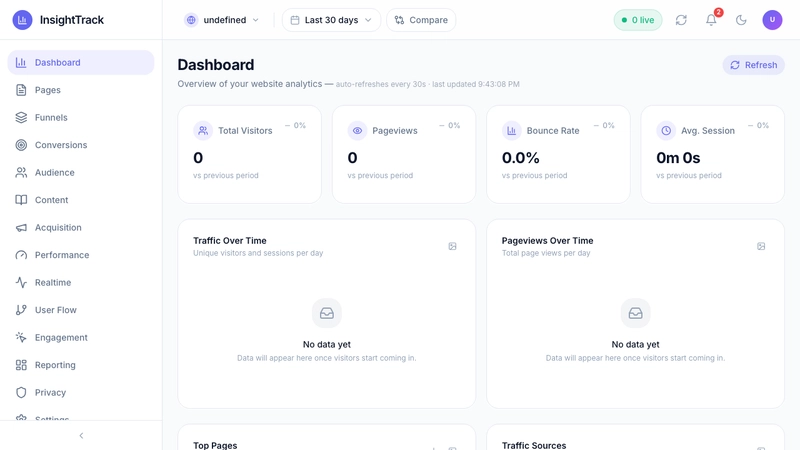 |
| KPI Cards + Sparklines | Traffic Charts |
|---|---|
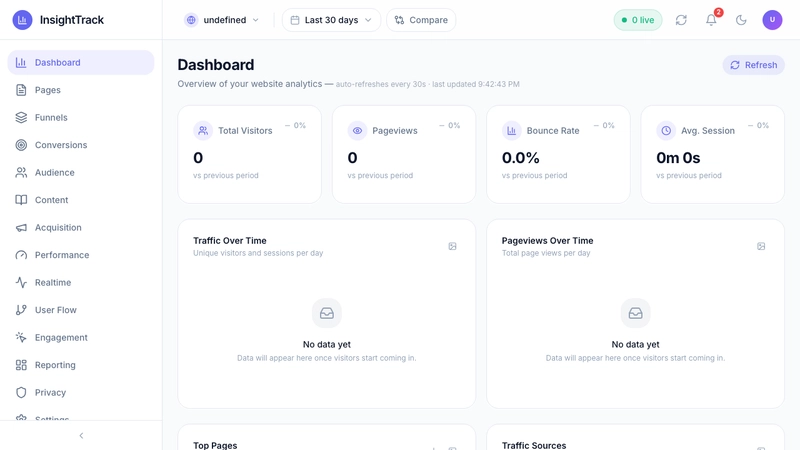 |
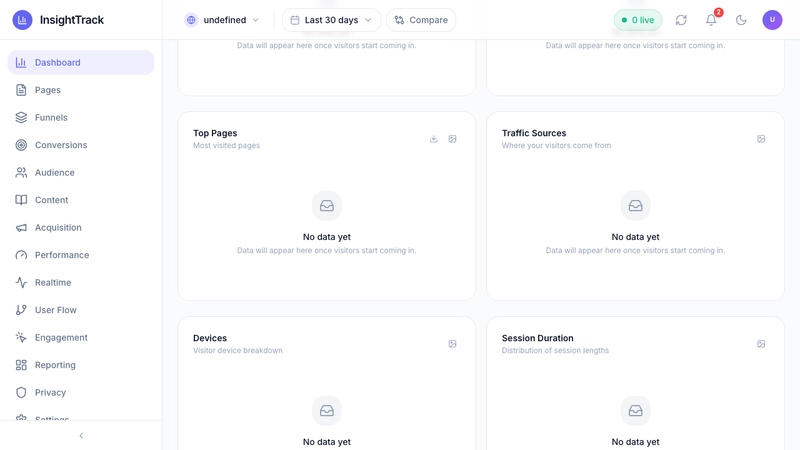 |

| User Flow (Sankey) | Real-Time |
|---|---|
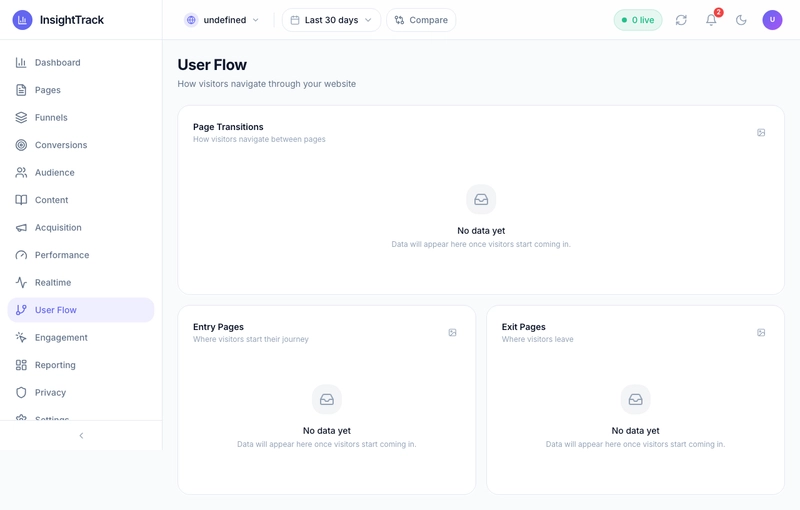 |
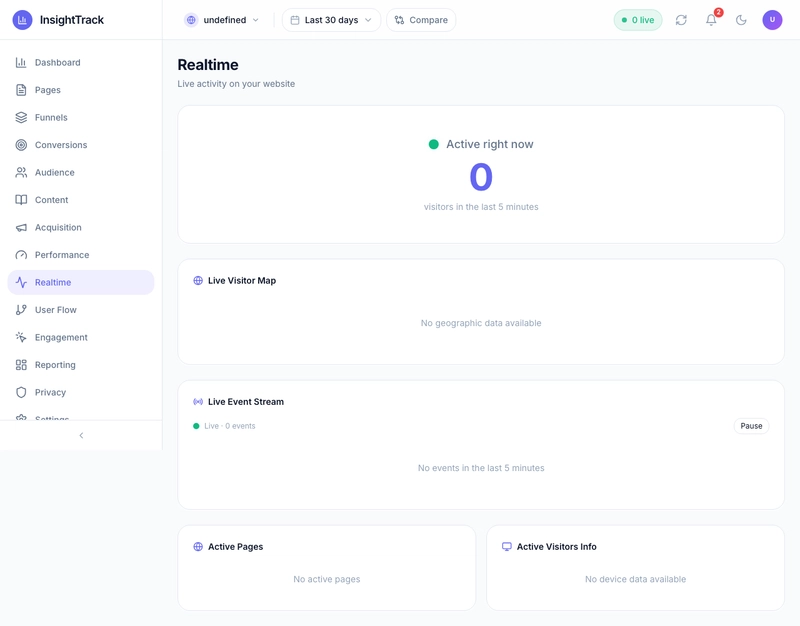 |
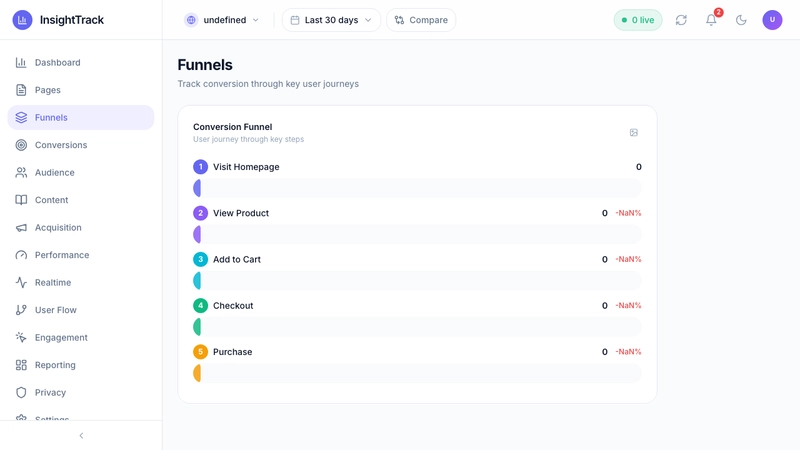
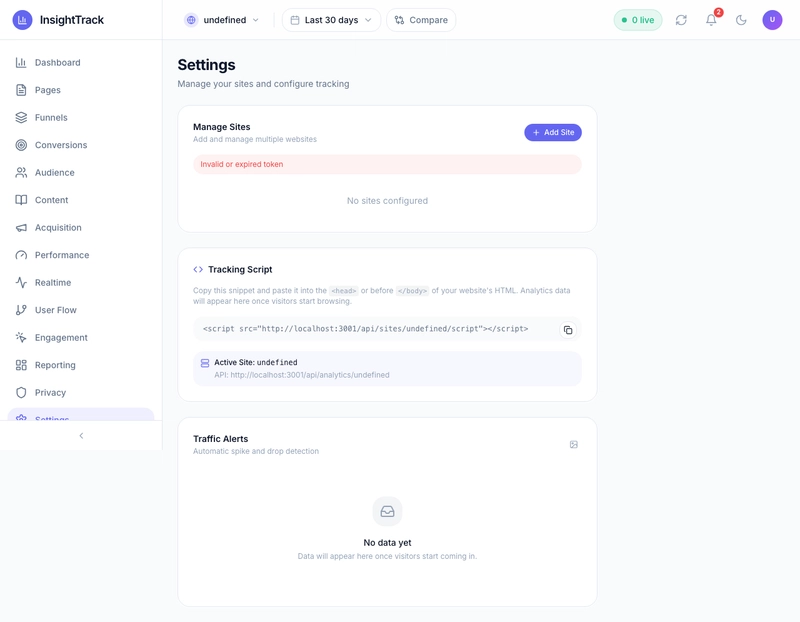
| Funnels | Settings |
|---|---|
 |
 |
| Top Pages | Profile |
|---|---|
 |
 |
| Documentation | API Reference |
|---|---|
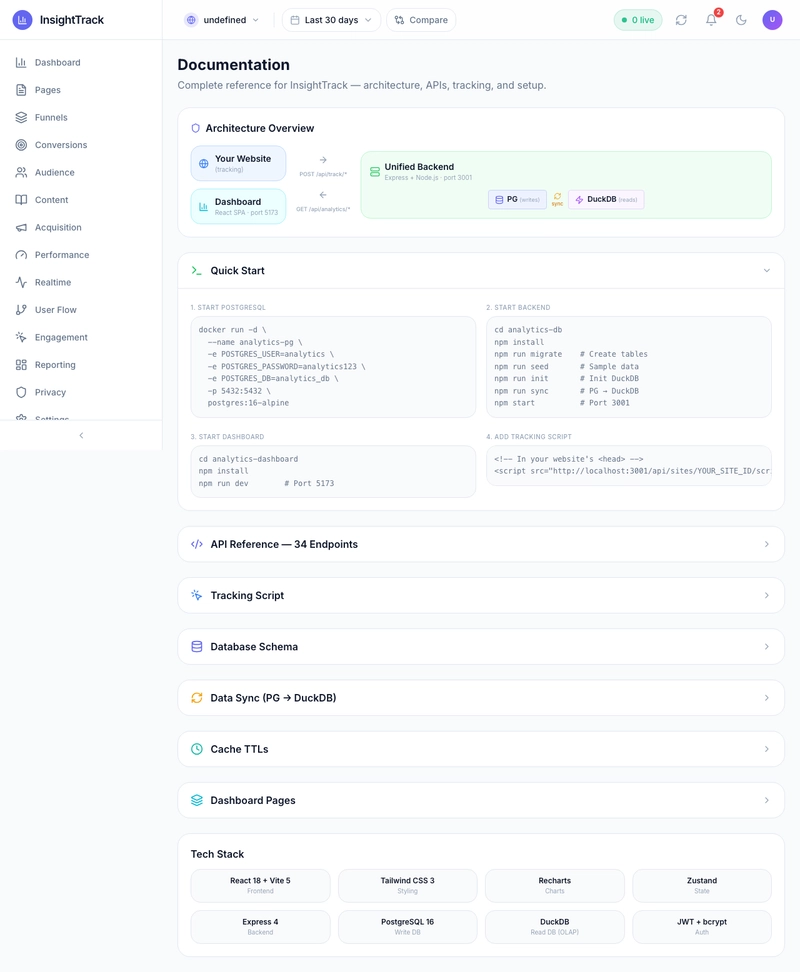 |
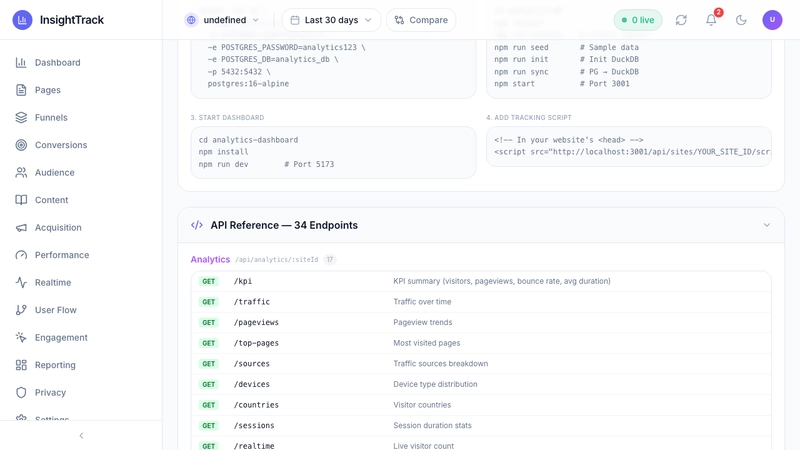 |
| Sidebar | Dark Landing |
|---|---|
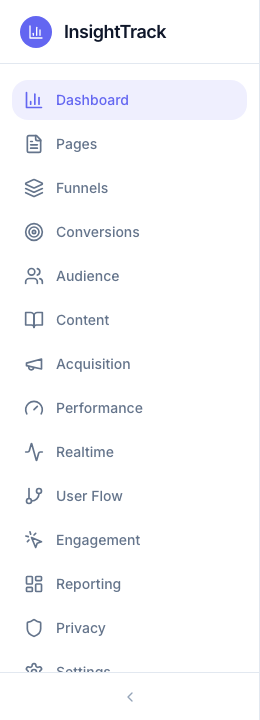 |
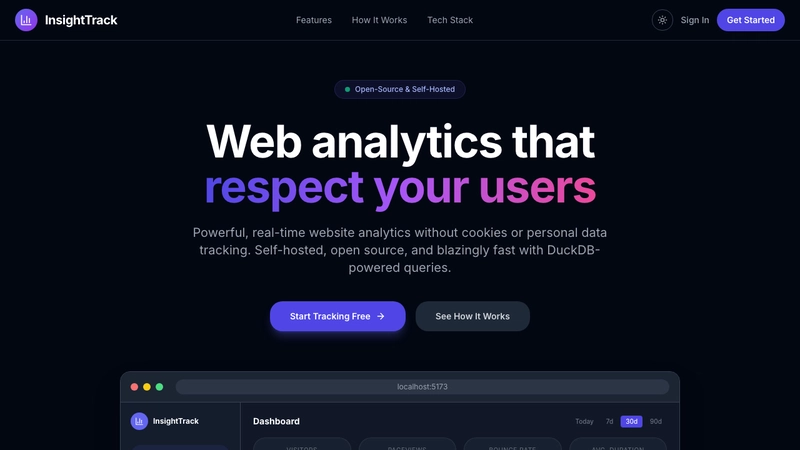 |
Stack: React 18 + Vite 5 + Tailwind CSS 3 · Express 4 + Node.js 20 · PostgreSQL + DuckDB · Docker Compose
v1 had the core loop working: embed a tracking script → events land in PostgreSQL → a sync worker copies rows into a flat DuckDB table → the React dashboard reads from DuckDB. The fundamental architecture was sound.
What v1 shipped:
But it had serious rough edges.
Performance wall. The DuckDB sync layer used a single flat table. On 90+ days of data, a KPI query scanned every row — ~620 ms on a local M1 machine. There was no partitioning, no archival strategy, and a crash meant rebuilding the entire table from scratch.
Half-finished features. There was a long list of planned but never-built ideas: UTM campaign tracking, comparison mode on charts, user flow analysis, a live visitor map on the Realtime page, engagement tracking, goal tracking, audience analytics, export to CSV/JSON — all unshipped.
UX gaps. The Settings page was a single form. The Documentation page was a placeholder. Half the pages lacked dark mode. There was no contextual help anywhere — a new user landing on the Funnels page had no idea what they were looking at.
No marketing story. The project had no landing page, no comparison table, no "why this instead of Google Analytics" pitch. It existed but didn't explain itself.
This was the most technically significant change. I replaced the flat DuckDB sync with a two-tier data lake:
site_id and event_date
data-lake/events/
  site_id=abc/
    event_date=2026-01-01/
      part-0001.parquet
    event_date=2026-01-02/
      part-0001.parquet
A transparent UNION ALL view sits on top of both tiers, so every existing dashboard query kept working without modification:
CREATE OR REPLACE VIEW events AS
  SELECT * FROM events_hot
  UNION ALL
  SELECT * FROM read_parquet(
    'data-lake/events/site_id=*/event_date=*/part-0001.parquet',
    hive_partitioning = true
  );
A dual-watermark incremental sync worker runs every 5 minutes, fetching only new rows from PostgreSQL using high-water marks (last_event_id for events, last_synced timestamp for sessions), then routing them to the correct tier based on age.
Result: 90-day queries dropped from ~620 ms → ~25 ms. A 25× speedup.
Recovery after a crash now resumes from the watermark instead of rebuilding the entire table.
The auto-generated analytics.js (~2 KB) handles everything without configuration:
| Data Point | How |
|---|---|
| Page URL & path | window.location.href |
| Referrer | document.referrer |
| Browser, OS, device |
navigator.userAgent + screen width heuristics |
| Country | Timezone via Intl.DateTimeFormat
|
| Session | Auto UUID in sessionStorage
|
| Anonymous user ID | Random UUID in localStorage — no cookies |
| Outbound link clicks |
click event listener |
| Scroll depth | 25/50/75/100% milestones on page unload |
| Time on page | Seconds per page sent on unload |
| Heatmap clicks | x/y coordinates + CSS selector of every click |
| Rage clicks | 3+ rapid clicks on same element within 1 second |
| Core Web Vitals | LCP, FID, CLS, INP, TTFB via PerformanceObserver
|
| JS errors |
window.onerror + unhandledrejection capture |
| Site search | Form submit interception |
| UTM parameters |
utm_source, utm_medium, utm_campaign, utm_term, utm_content
|
| SPA navigation |
popstate + pushState / replaceState listeners |
Privacy built-in: DNT (navigator.doNotTrack) and GPC (navigator.globalPrivacyControl) are respected — if either is set, no data is collected.
Custom events are available via window.analytics.track('event_name', { ...properties }).
Core Dashboard
The main dashboard now has comparison mode — every chart can overlay the current period against the previous period. All 4 KPI cards have sparkline mini-charts. Date picker supports custom ranges in addition to presets.
Real-Time
Engagement Analytics
Four metrics measured automatically by the tracking script:
| Metric | What it shows |
|---|---|
| Scroll Depth | Per-page average scroll %; milestone table (25/50/75/100%) |
| Click Heatmaps | x/y dot map per page, top clicked elements ranked |
| Rage Click Detection | Pages and elements triggering 3+ rapid clicks within 1 second |
| Time on Page | Average, median, min/max read time per page |
User Flow & Funnels
Conversion & Goals
Audience Analytics
Content Analytics
Acquisition Analytics
Performance Monitoring
Core Web Vitals collected automatically:
| Metric | Good | Needs Improvement | Poor |
|---|---|---|---|
| LCP (Largest Contentful Paint) | ≤ 2.5s | ≤ 4.0s | > 4.0s |
| FID (First Input Delay) | ≤ 100ms | ≤ 300ms | > 300ms |
| CLS (Cumulative Layout Shift) | ≤ 0.1 | ≤ 0.25 | > 0.25 |
| INP (Interaction to Next Paint) | ≤ 200ms | ≤ 500ms | > 500ms |
| TTFB (Time to First Byte) | ≤ 800ms | ≤ 1800ms | > 1800ms |
Color-coded metric cards (green/yellow/red) + per-page breakdown table.
JavaScript error tracking: message, source file, line/column, stack trace, error trend chart over time.
Reporting & Export
Multi-Site Management
PageNote banner with a business explanation and a developer tip per pageInfoTooltip on every MetricCard and ChartCard
Hero, features grid, 3-step "How It Works", tech stack cards, and a side-by-side comparison table vs. Google Analytics across 9 dimensions.
| Dimension | v1 (Before) | v2 (After) |
|---|---|---|
| 90-day query time | ~620 ms | ~25 ms (25×) |
| DuckDB architecture | Single flat table, full scan | Hot (in-memory) + Cold (Parquet), UNION view |
| Sync on crash | Full table rebuild | Resumes from dual watermark |
| Analytics pages | 7 | 13 |
| Tracking data points | 8 | 19 |
| Real-Time page | Active count only | Map + event stream + device breakdown |
| Engagement tracking | None | Scroll depth, heatmaps, rage clicks, time on page |
| Conversion & Goals | Funnels only | Goals, A/B testing, revenue attribution |
| Audience analytics | None | New/returning, cohorts, segments |
| Content analytics | Top pages only | Entry/exit pages, page flow, site search |
| Acquisition analytics | None | UTM campaigns, social, keywords, link builder |
| Performance monitoring | None | Core Web Vitals + JS error tracking |
| Reporting | None | Export, annotations, scheduled reports, custom dashboards |
| Multi-site | Single site | Unlimited sites with per-site settings |
| Comparison mode | None | Previous-period overlay on all charts |
| Export | None | CSV / JSON / PNG |
| Settings page | Single form | 4-tab layout with site manager |
| Contextual help | None |
PageNote + InfoTooltip on every page |
| Dark mode coverage | Partial | Complete |
| Marketing landing page | None | Full page with comparison table |
I'll be direct: I would not have shipped v2 without GitHub Copilot. Not because the individual problems were too hard — but because there were so many of them, and I was coming back to code I hadn't touched in months.
The architecture lift. The Hot+Cold DuckDB design required a new sync worker, new schema migrations, new UNION views, and updates to every existing query file simultaneously. Copilot helped me work through design decisions conversationally — I'd describe the constraint ("crash recovery must resume from a watermark, not rebuild the whole table") and it would walk me through the dual-watermark pattern, flag edge cases I hadn't considered (what happens to a row that ages from hot to cold between two sync cycles?), and generate the implementation that fit the existing codebase style.
The feature sweep. Going from 8 tracked data points to 19, from 7 pages to 13, from basic funnels to engagement tracking, cohort analysis, Web Vitals, and revenue attribution is a context-switching marathon. Copilot compressed the ramp-up time on each feature dramatically. When I opened the Acquisition page for the first time in months, Copilot immediately understood the existing data model, knew which UTM fields were already being captured in the tracking script, and scaffolded the campaign dashboard components that matched the existing useAnalytics hook pattern — not generic code, but code that fit this project.
The consistency work. The PageNote and InfoTooltip additions touched 13 pages. Adding Core Web Vitals collection to the tracking script required coordinating between analytics.js, the Express ingest route, the DuckDB schema, and the React performance page — four files that had to stay in sync. Copilot held the full context across all of them.
The documentation. Writing accurate technical docs for a system you know deeply is surprisingly tedious. Copilot drafted the architecture document for the hot/cold system from the actual code — referencing the real SQL, the real file paths, the real config variables — and I edited for clarity rather than writing from scratch.
The interaction style that worked best wasn't "write this for me." It was: here's the constraint, here's the existing pattern, here's where I'm confused. Copilot as a collaborator who has read your entire codebase is a genuinely different experience from Copilot as autocomplete. The finish-up phase of a project — juggling context across a dozen half-done things — is exactly where that kind of always-available, always-context-aware pair programmer pays off most.
InsightTrack v2 is the project I always meant to ship. It just needed time, a clear plan, and a better way to work through the backlog.
InsightTrack is open source — self-host your own privacy-first analytics in minutes.