保留正文与补采附件。源页面当前未重新核验;具体限制见交付清单。
 We value your privacy
We use cookies to enhance your browsing experience, serve personalised ads or content, and analyse our traffic. By clicking "Accept All", you consent to our use of cookies.
Customise Reject All Accept All
Customise Consent Preferences
 We use cookies to help you navigate efficiently and perform certain functions. You will find detailed information about all cookies under each consent category below.
The cookies that are categorised as "Necessary" are stored on your browser as they are essential for enabling the basic functionalities of the site. ... Show more
NecessaryAlways Active
Necessary cookies are required to enable the basic features of this site, such as providing secure log-in or adjusting your consent preferences. These cookies do not store any personally identifiable data.
-
Cookie
BCTempID
-
Duration
10 minutes
-
Description
No description available.
-
Cookie
__cf_bm
-
Duration
1 hour
-
Description
This cookie, set by Cloudflare, is used to support Cloudflare Bot Management.
-
Cookie
AWSALBCORS
-
Duration
7 days
-
Description
Amazon Web Services set this cookie for load balancing.
-
Cookie
_cfuvid
-
Duration
session
-
Description
Cloudflare sets this cookie to track users across sessions to optimize user experience by maintaining session consistency and providing personalized services
-
Cookie
li_gc
-
Duration
6 months
-
Description
Linkedin set this cookie for storing visitor's consent regarding using cookies for non-essential purposes.
-
Cookie
__hssrc
-
Duration
session
-
Description
This cookie is set by Hubspot whenever it changes the session cookie. The __hssrc cookie set to 1 indicates that the user has restarted the browser, and if the cookie does not exist, it is assumed to be a new session.
-
Cookie
__hssc
-
Duration
1 hour
-
Description
HubSpot sets this cookie to keep track of sessions and to determine if HubSpot should increment the session number and timestamps in the __hstc cookie.
-
Cookie
wpEmojiSettingsSupports
-
Duration
session
-
Description
WordPress sets this cookie when a user interacts with emojis on a WordPress site. It helps determine if the user's browser can display emojis properly.
-
Cookie
BCSessionID
-
Duration
1 year 1 month 4 days
-
Description
Blueconic sets this cookie as a unique identifier for the BlueConic profile.
-
Cookie
_octo
-
Duration
1 year
-
Description
No description available.
-
Cookie
logged_in
-
Duration
1 year
-
Description
No description available.
-
Cookie
__Secure-YEC
-
Duration
past
-
Description
YouTube sets this cookie to stores the user's video player preferences using embedded YouTube video
-
Cookie
__eoi
-
Duration
6 months
-
Description
Description is currently not available.
-
Cookie
AWSALBTGCORS
-
Duration
7 days
-
Description
No description available.
-
Cookie
login-status-p
-
Duration
past
-
Description
Description is currently not available.
-
Cookie
AWSALBTG
-
Duration
7 days
-
Description
No description available.
-
Cookie
csrf_token
-
Duration
session
-
Description
No description available.
-
Cookie
token_v2
-
Duration
1 day
-
Description
Description is currently not available.
-
Cookie
D
-
Duration
1 year
-
Description
Description is currently not available.
-
Cookie
PHPSESSID
-
Duration
session
-
Description
This cookie is native to PHP applications. The cookie stores and identifies a user's unique session ID to manage user sessions on the website. The cookie is a session cookie and will be deleted when all the browser windows are closed.
-
Cookie
VISITOR_PRIVACY_METADATA
-
Duration
6 months
-
Description
YouTube sets this cookie to store the user's cookie consent state for the current domain.
-
Cookie
cookietest
-
Duration
session
-
Description
The cookietest cookie is typically used to determine whether the user's browser accepts cookies, essential for website functionality and user experience.
-
Cookie
__Host-airtable-session
-
Duration
1 year
-
Description
This cookie is used to enable us to integrate the services of Airtable.
-
Cookie
__Host-airtable-session.sig
-
Duration
1 year
-
Description
This cookie is used to enable us to integrate the services of Airtable.
-
Cookie
m
-
Duration
1 year 1 month 4 days
-
Description
Stripe sets this cookie for fraud prevention purposes. It identifies the device used to access the website, allowing the website to be formatted accordingly.
-
Cookie
BIGipServer*
-
Duration
session
-
Description
Marketo sets this cookie to collect information about the user's online activity and build a profile about their interests to provide advertisements relevant to the user.
-
Cookie
__cfruid
-
Duration
session
-
Description
Cloudflare sets this cookie to identify trusted web traffic.
-
Cookie
_GRECAPTCHA
-
Duration
6 months
-
Description
Google Recaptcha service sets this cookie to identify bots to protect the website against malicious spam attacks.
-
Cookie
__Secure-YNID
-
Duration
6 months
-
Description
Google cookie used to protect user security and prevent fraud, especially during the login process.
-
Cookie
cookieyes-consent
-
Duration
1 year
-
Description
CookieYes sets this cookie to remember users' consent preferences so that their preferences are respected on subsequent visits to this site. It does not collect or store any personal information about the site visitors.
Functional
Functional cookies help perform certain functionalities like sharing the content of the website on social media platforms, collecting feedback, and other third-party features.
-
Cookie
lidc
-
Duration
1 day
-
Description
LinkedIn sets the lidc cookie to facilitate data center selection.
-
Cookie
brw
-
Duration
1 year
-
Description
No description available.
-
Cookie
brwConsent
-
Duration
5 minutes
-
Description
Description is currently not available.
-
Cookie
WMF-Uniq
-
Duration
1 year
-
Description
Description is currently not available.
-
Cookie
loom_anon_comment
-
Duration
1 year
-
Description
No description available.
-
Cookie
loom_referral_video
-
Duration
session
-
Description
Description is currently not available.
-
Cookie
VISITOR_INFO1_LIVE
-
Duration
6 months
-
Description
A cookie set by YouTube to measure bandwidth that determines whether the user gets the new or old player interface.
-
Cookie
yt-remote-connected-devices
-
Duration
Never Expires
-
Description
YouTube sets this cookie to store the user's video preferences using embedded YouTube videos.
-
Cookie
ytidb::LAST_RESULT_ENTRY_KEY
-
Duration
Never Expires
-
Description
The cookie ytidb::LAST_RESULT_ENTRY_KEY is used by YouTube to store the last search result entry that was clicked by the user. This information is used to improve the user experience by providing more relevant search results in the future.
-
Cookie
yt-remote-device-id
-
Duration
Never Expires
-
Description
YouTube sets this cookie to store the user's video preferences using embedded YouTube videos.
-
Cookie
yt-remote-session-name
-
Duration
session
-
Description
The yt-remote-session-name cookie is used by YouTube to store the user's video player preferences using embedded YouTube video.
-
Cookie
yt-remote-fast-check-period
-
Duration
session
-
Description
The yt-remote-fast-check-period cookie is used by YouTube to store the user's video player preferences for embedded YouTube videos.
-
Cookie
yt-remote-session-app
-
Duration
session
-
Description
The yt-remote-session-app cookie is used by YouTube to store user preferences and information about the interface of the embedded YouTube video player.
-
Cookie
yt-remote-cast-available
-
Duration
session
-
Description
The yt-remote-cast-available cookie is used to store the user's preferences regarding whether casting is available on their YouTube video player.
-
Cookie
yt-remote-cast-installed
-
Duration
session
-
Description
The yt-remote-cast-installed cookie is used to store the user's video player preferences using embedded YouTube video.
-
Cookie
cp_session
-
Duration
3 months
-
Description
Codepen sets this cookie for Help systems found in the website.
-
Cookie
loid
-
Duration
1 year 1 month 4 days
-
Description
This cookie is set by the Reddit. The cookie enables the sharing of content from the website onto the social media platform.
Analytics
Analytical cookies are used to understand how visitors interact with the website. These cookies help provide information on metrics such as the number of visitors, bounce rate, traffic source, etc.
-
Cookie
__hstc
-
Duration
6 months
-
Description
Hubspot set this main cookie for tracking visitors. It contains the domain, initial timestamp (first visit), last timestamp (last visit), current timestamp (this visit), and session number (increments for each subsequent session).
-
Cookie
hubspotutk
-
Duration
6 months
-
Description
HubSpot sets this cookie to keep track of the visitors to the website. This cookie is passed to HubSpot on form submission and used when deduplicating contacts.
-
Cookie
_ga
-
Duration
1 year 1 month 4 days
-
Description
Google Analytics sets this cookie to calculate visitor, session and campaign data and track site usage for the site's analytics report. The cookie stores information anonymously and assigns a randomly generated number to recognise unique visitors.
-
Cookie
ga*
-
Duration
1 year 1 month 4 days
-
Description
Google Analytics sets this cookie to store and count page views.
-
Cookie
__Host-psifi.analyticsTrace
-
Duration
6 hours
-
Description
Description is currently not available.
-
Cookie
__Host-psifi.analyticsTraceV2
-
Duration
6 hours
-
Description
Description is currently not available.
-
Cookie
_gh_sess
-
Duration
session
-
Description
GitHub sets this cookie for temporary application and framework state between pages like what step the user is on in a multiple step form.
-
Cookie
YSC
-
Duration
session
-
Description
YSC cookie is set by Youtube and is used to track the views of embedded videos on Youtube pages.
-
Cookie
ajs_anonymous_id
-
Duration
1 year
-
Description
This cookie is set by Segment to count the number of people who visit a certain site by tracking if they have visited before.
-
Cookie
vuid
-
Duration
1 year 1 month 4 days
-
Description
Vimeo installs this cookie to collect tracking information by setting a unique ID to embed videos on the website.
Performance
Performance cookies are used to understand and analyse the key performance indexes of the website which helps in delivering a better user experience for the visitors.
-
Cookie
AWSALB
-
Duration
7 days
-
Description
AWSALB is an application load balancer cookie set by Amazon Web Services to map the session to the target.
-
Cookie
acq
-
Duration
past
-
Description
Description is currently not available.
-
Cookie
acq.sig
-
Duration
past
-
Description
Description is currently not available.
-
Cookie
ptc
-
Duration
2 years
-
Description
No description available.
Advertisement
Advertisement cookies are used to provide visitors with customised advertisements based on the pages you visited previously and to analyse the effectiveness of the ad campaigns.
-
Cookie
muc_ads
-
Duration
1 year 1 month 4 days
-
Description
Twitter sets this cookie to collect user behaviour and interaction data to optimize the website.
-
Cookie
guest_id_marketing
-
Duration
1 year 1 month 4 days
-
Description
Twitter sets this cookie to identify and track the website visitor.
-
Cookie
guest_id_ads
-
Duration
1 year 1 month 4 days
-
Description
Twitter sets this cookie to identify and track the website visitor.
-
Cookie
personalization_id
-
Duration
1 year 1 month 4 days
-
Description
Twitter sets this cookie to integrate and share features for social media and also store information about how the user uses the website, for tracking and targeting.
-
Cookie
guest_id
-
Duration
1 year 1 month 4 days
-
Description
Twitter sets this cookie to identify and track the website visitor. It registers if a user is signed in to the Twitter platform and collects information about ad preferences.
-
Cookie
bcookie
-
Duration
1 year
-
Description
LinkedIn sets this cookie from LinkedIn share buttons and ad tags to recognize browser IDs.
-
Cookie
__Secure-ROLLOUT_TOKEN
-
Duration
6 months
-
Description
YouTube sets this cookie to manage feature rollout and experimentation. It helps Google control which new features or interface changes are shown to users as part of testing and staged rollouts, ensuring consistent experience for a given user during an experiment.
-
Cookie
yt.innertube::nextId
-
Duration
Never Expires
-
Description
YouTube sets this cookie to register a unique ID to store data on what videos from YouTube the user has seen.
-
Cookie
yt.innertube::requests
-
Duration
Never Expires
-
Description
YouTube sets this cookie to register a unique ID to store data on what videos from YouTube the user has seen.
-
Cookie
session_tracker
-
Duration
session
-
Description
This cookie is set by the Reddit. This cookie is used to identify trusted web traffic. It also helps in adverstising on the website.
-
Cookie
edgebucket
-
Duration
session
-
Description
Reddit sets this cookie to save the information about a log-on Reddit user, for the purpose of advertisement recommendations and updating the content.
-
Cookie
did
-
Duration
1 year
-
Description
Arbor sets this cookie to show targeted ads to site visitors.This cookie expires after 2 months or 1 year.
Uncategorised
Other uncategorised cookies are those that are being analysed and have not been classified into a category as yet.
No cookies to display.
Reject All Save My Preferences Accept All
Toggle SearchToggle Mobile Navigation
Publish AI, ML & data-science insights to a global community of data professionals.
Sign inSubmit an Article
LatestEditor's PicksNewsletterShipAI
Write For TDS
LinkedInXToggle Search
Data Science
Bayesian Statistics
Hard to believe there was once a controversy over probabilistic statistics
James Andrew Godwin
February 25, 202117 min read
 Frequentists vs Bayesians | Photo by Lucas Benjamin
This article builds on my previous article about Bootstrap Resampling.
Learn this step by step with the interactive AI and Data Scientist roadmap.
Introduction to Bayes Models
Bayesian models are a rich class of models, which can provide attractive alternatives to Frequentist models. Arguably the most well-known feature of Bayesian statistics is Bayes theorem, more on this later. With the recent advent of greater computational power and general acceptance, Bayes methods are now widely used in areas ranging from medical research to natural language processing (NLP) to understanding to web searches.
In the early 20th century there was a big debate about the legitimacy of what is now called Bayesian, which is essentially a probabilistic way of doing some statistics - in contrast to the "Frequentist" camp that we are all intimately familiar with. To use the parlance of our times, it was the #Team Jacob vs #Team Edward debate of its time, among statisticians. The argument is now moot as almost everyone is both Bayesian and Frequentist. A good heuristic is that some problems are better handled by Frequentist methods and some with Bayesian methods.
By the end of this article I hope you can appreciate this joke: A Bayesian is one who, vaguely expecting a horse, and catching a glimpse of a donkey, strongly believes she has seen a mule!
History
A limited version of Bayes theorem was proposed by the eponymous Reverend Thomas Bayes (1702–1761). Bayes' interest was in probabilities of gambling games. He also was an avid supporter of Sir Isaac Newton's newfangled theory of calculus with his amazingly entitled publication, "An Introduction to the Doctrine of Fluxions, and a Defence of the Mathematicians Against the Objections of the Author of The Analyst."
In 1814, Pierre-Simon Laplace published a version of Bayes theorem similar to its modern form in the "Essai philosophique sur les probabilités." Laplace applied Bayesian methods to problems in celestial mechanics. Solving these problems had great practical implications for ships in the late 18th/early 19th centuries. The geophysicist and mathematician Harold Jeffreys extensively used Bayes' methods.
WWII saw many successful applications of Bayesian methods:
- Andrey Kolmagorov, a Russian (née Soviet) statistician used Bayes methods to greatly improve artillery accuracy
- Alan Turing used Bayesian models to break German U-boat codes
- Bernard Koopman, French born American mathematician, helped the Allies ability to locate German U-boats by intercepting directional radio transmissions
The latter half of the 20th century lead to the following notable advances in computational Bayesian methods:
- Statistical sampling using Monte Carlo methods; Stanislaw Ulam, John von Neuman; 1946, 1947
- MCMC, or Markov Chain Monte Carlo; Metropolis et al. (1953) Journal of Chemical Physics
- Hastings (1970), Monte Carlo sampling methods using Markov chains and their application
- Geman and Geman (1984) Stochastic relaxation, Gibbs distributions and the Bayesian restoration of images
- Duane, Kennedy, Pendleton, and Roweth (1987), Hamiltonian MCMC
- Gelfand and Smith (1990), Sampling-based approaches to calculating marginal densities.
Bayesian vs Frequentist views
With greater computational power and general acceptance, Bayes methods are now widely used in areas ranging from medical research to natural language understanding to web search. Among pragmatists, the common belief today is that some problems are better handled by frequentist methods and some with Bayesian methods.
From my first article on the Central Limit Theorem (CLT), I established that you need "enough data" for the CLT to apply. Bootstrap sampling is a convenient way of obtaining more distributions that approach your underlying distribution. These are Frequentist tools; but what happens if you have too little data to reliably apply the CLT? As a probabilistic Bayesian statistician, I already have some estimates, admittedly, with a little bit of guesswork, but there is a way of combining that guesswork in an intelligent fashion with my data. And that is what Bayesian statistics is basically all about - you combine it and basically, that combination is a simple multiplication of the two probable probability distributions, the one that you guessed at, and the other one, that for which you have evidence.
The more data you have, the prior distribution becomes less and less important and Frequentist methods can be used. But, with less data, Bayesian's will give you a better answer.
So how then do Bayesian and Frequentist methodologies differ? Simply stated:
- Bayesian methodologies use prior distributions to quantify what is known about the parameters
- Frequentists do not quantify anything about the parameters; instead using p-values and confidence intervals (CI's) to express the unknowns about parameters
Both methods are useful, converging with more and more data - but contrasted:
Strict Frequentist approach
- Goal is a point estimate and CI
- Start from observations
- Re-compute model given new observations
- Examples: Mean estimate, t-test, ANOVA
Bayesian approach
- Goal is posterior distribution
- Start from prior distribution (the guesswork)
- Update posterior (the belief/hypothesis) given new observations
- Examples: posterior distribution of mean, highest density interval (HDI) overlap
Today no one is a strict Frequentist. Bayesian methodologies simply work, that is fact.
Bayes theorem
Bayes theorem describes the probability of an event, based on prior knowledge (our guesswork) of conditions that might be related to the event, our data. Bayes theorem tells us how to combine these two probabilities. For example, if developing a disease like Alzheimer's is related to age, then, using Bayes' theorem, a person's age can be used to more reliably assess the probability that they have Alzheimer's, or cancer, or any other age-related disease.
Bayes theorem is used to update the probability for a hypothesis; the hypothesis is this guesswork, this prior distribution thing. Prior means your prior belief, the belief that you have before you have evidence, and it is a way to update it. Because you get more information, you update your hypothesis, and so on and so forth.
For those who do not know, or who have forgotten, let us derive Bayes theorem from the rule for conditional probability:
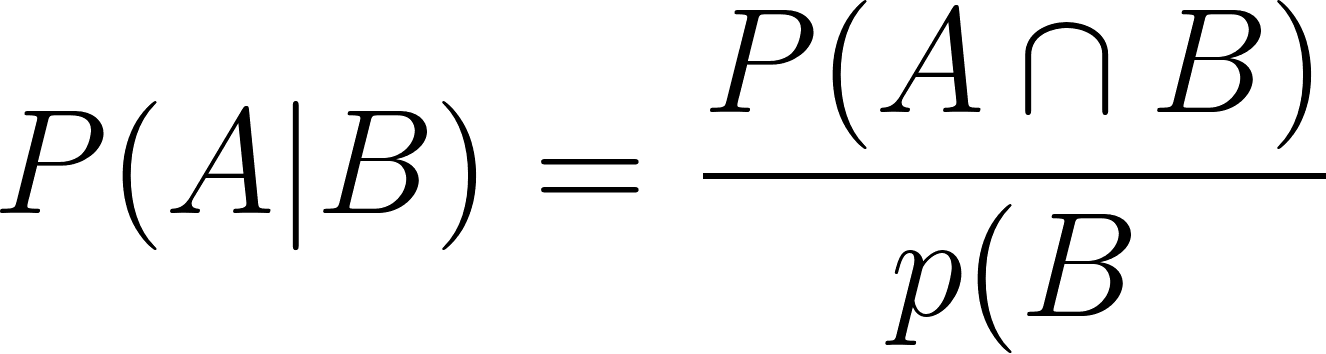 Conditional probability
Translates to "the probability of A happening given B is the case."
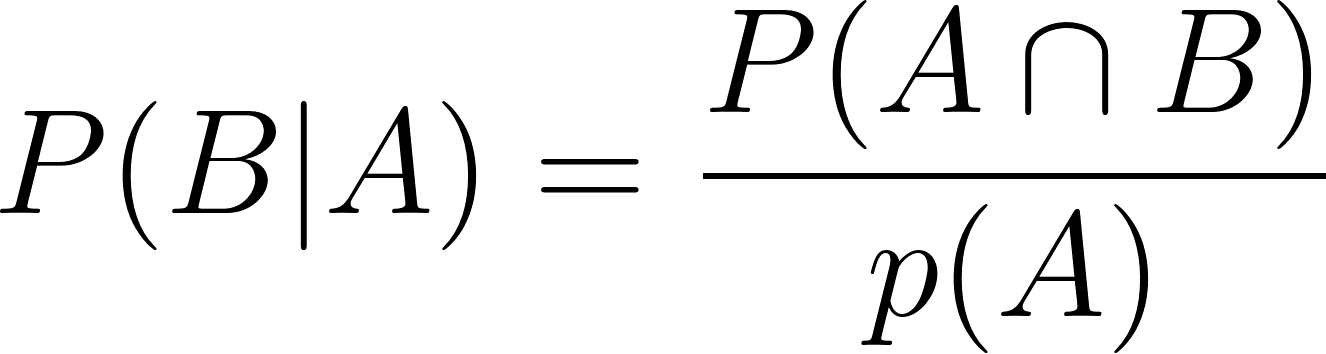 "The probability of B happening given A happens."
Eliminating 𝑃(𝐴∩𝐵) and doing very minor algebra:
 or, rearranging terms
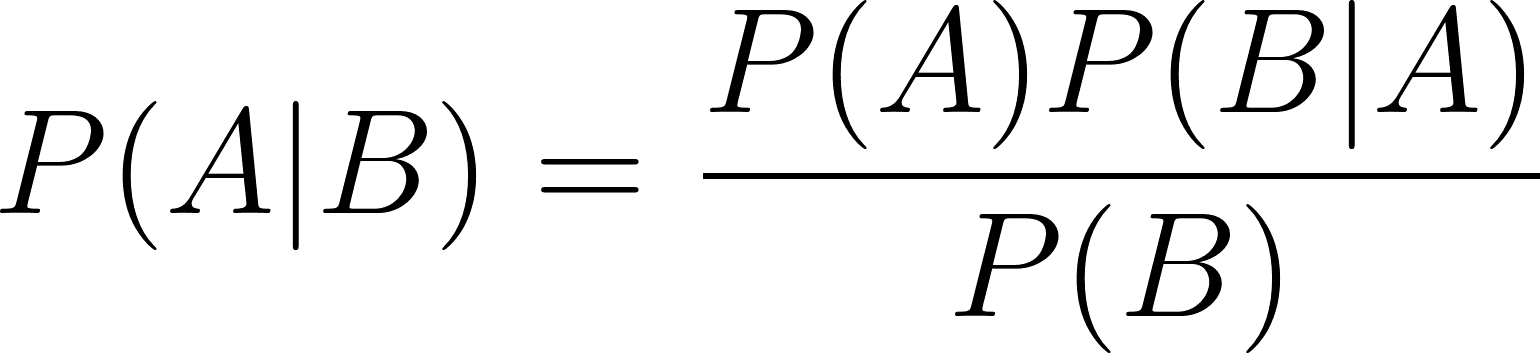 Which is Bayes theorem! This describes how one finds the conditional probability of event A given event B.
Applications
You have a disease test, and the probability that you will get a positive test result given that you have the disease is really, really high; in other words the test has a very high accuracy rate. The problem is that there is a probability that you will get a positive test result even if you do not have the disease. And that you can simply calculate from Bayes law. The big point is, is that these probabilities are not the same as the probability that you will get a positive result given the disease is not the same as the probability that you will have the disease given a positive result.
 The test sensitivity does not match the rate of incidence of the disease
These are two different probability distributions. And what makes them so different is the probability of disease and the probability of a positive test result. So if the disease is rare, the probability of disease will be very, very small.
Disease testing: A = Have disease, B = Tested positive.

Example
 The sensitivity of this test is quite bad despite the high accuracy of the test
Using Bayes theorem we have deduced that a positive test result for this disease indicates that only 10% of the time the person will actually have the disease, because the incidence rate of the disease is an order of magnitude lower than the false positive rate.
Python example: probabilities of hair and eye color
A sample population has the following probabilities of hair and eye color combinations. I will run the code below in a Jupyter Notebook to find the conditional probabilities:
text
# begin with the imports
import pandas as pd
import numpy as np
import matplotlib
from matplotlib import pyplot as plt
import scipy
import seaborn as sns
import itertools
text
%matplotlib inline
text
# create the dataframe
hair_eye = pd.DataFrame({
    'black': [0.11, 0.03, 0.03, 0.01],
    'blond': [0.01, 0.16, 0.02, 0.03],
    'brunette': [0.2, 0.14, 0.09, 0.05],
    'red': [0.04, 0.03, 0.02, 0.02],

}, index=['brown', 'blue', 'hazel', 'green'])
text
hair_eye
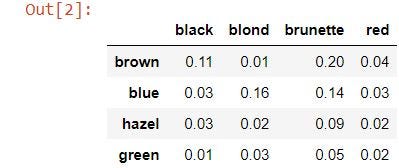 N.B: this is string index for eye color rather than a numeric zero-based index.
text
hair_eye.loc['hazel', 'red']
 2% of people have hazel eyes given red hair
The figures in the table above are the conditional probabilities. Note that in this case:
𝑃(hair|eye)=𝑃(eye|hair)P(hair|eye)=P(eye|hair)
Given these conditional probabilities, it is easy to compute the marginal probabilities by summing the probabilities in the rows and columns. The marginal probability is the probability along one variable (one margin) of the distribution. The marginal distributions must sum to unity (1).
text
## Compute the marginal distribution of each eye color
hair_eye['marginal_eye'] = hair_eye.sum(axis=1)
text
hair_eye
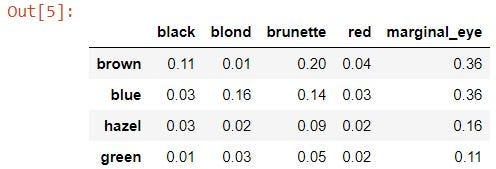 Added marginal_eye column
text
hair_eye.sum(axis=0)
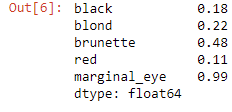 The hair color probabilities sum to unity
text
hair_eye.loc['marginal_hair'] = hair_eye.sum(axis=0)
hair_eye.describe
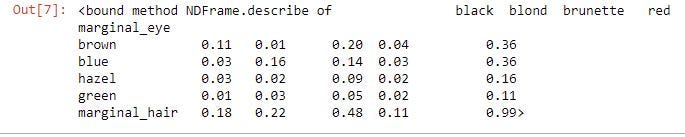 The eye color probabilities also sum to 1.0
I have blue eyes. I wonder what the marginal probabilities of hair color are given that they have blue eyes?
text
# probability of blue eyes given any hair color divided by total probability of blue eyes
text
# marginal probabilities of hair color given blue eyes
#blue_black(.03/.36) + blue_brunette(.14/.36) + blue_red(.03/.36) + blue_blond(.16/.36)
blue = hair_eye.loc['blue',:]/hair_eye.loc['blue','marginal_eye']
blue
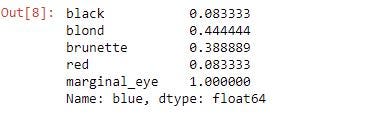 For a given person with blue eyes, it is 44% likely they have blond hair, like me
Applying Bayes theorem
There is a formulation of Bayes theorem that is convenient to use for computational problems because we do not want to sum all of the possibilities to compute P(B) , like in the example above.
Here are more facts and relationships about conditional probabilities, largely arising from the fact that P(B) is so hard to calculate:
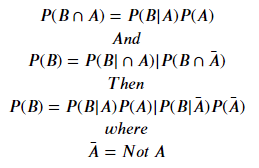 Rewriting Bayes theorem:
 This is a mess, but we do not always need the complicated denominator, which is the probability of B. P(B) is our actual evidence, which is hard to come by. Remember that this is probabilistic and that we are working with smaller data samples than we are normally used to.
Rewriting we get:
 Ignoring the constant 𝑘, b ecause it is given that the evidence - P(B) - is presumed to be constant, we get:
 We do not need to know the probability distribution of the actual evidence, of the data
Applying the reduced relationship Bayes theorem
We interpret the reduced relationship above as follows:
 Proportional Bayes
The proportional relationships apply to the observed data distributions, or to parameters in a model (partial slopes, intercept, error distributions, lasso constant, e.g.,). The above equations tell you how to combine your prior belief if you want to call that, which I call the prior distribution with your evidence.
An important nuance is that while we cannot speak about exact values we can talk about distributions; we can talk about the shapes of the curves of the probability distribution curves. What we want is the so-called posterior distribution. That is what we want. What we do is guess at the prior distribution: what is the probability of A? What is the probability that something is true given the data that I have? What is the probability of A given B? what is the probability that something is true given the data I have? Some people will rephrase this as what is the probability that my hypothesis A is true given the data B?
I might have very little data. Too little to do any Frequentist approaches; but I can estimate that with the little small amount of data I have, called the likelihood , I can estimate the probability that this data would be correct, given my hypothesis that I can calculate directly. Because I have the data, not a lot of data, it is too little for me to actually believe, but I have some data. And I have my hypothesis. And so I can do my calculations on my distributions.
The prior distribution is the probability of my hypothesis, which I do not know - but I can guess it. If I am really bad at guessing, I am going to say that this prior distribution is a uniform distribution , it could be a Gaussian or any other shape. Now if I guess a uniform distribution I am still doing probabilistic statistics, Bayesian statistics, but I am getting really, really close to what Frequentists would do.
In Bayesian, I will update this prior distribution as I get more data because I will say, "Hey!" at first I thought it was uniform. Now I see that this thing, this probability distribution actually has a mean somewhere in the middle. So I am now going to choose a different distribution. Or I'm going to modify my distribution to accommodate what I am seeing in my posterior. I am trying to make this prior distribution look similar in shape to my posterior distribution. And when I say similar in shape, that is actually very misleading. What I am trying to do is find a mathematical formula that will mix the probability of A and the probability of A given B similarly. Similar in type that the math, that the equation looks similar, as in the formulaic of the question and not the actual probabilities; we call that getting the conjugate prior. This is when you search for a distribution that is mathematically similar to what you believe to be the final distribution. This is formally referred to as searching for a conjugate prior. A beta distribution, because of its flexibility is often, but not always, used as the prior.
To reiterate, the hypothesis is formalized as parameters in the model , P(A), and the likelihood, P(B|A) , is the probability of the data given those parameters - this is easy to do, t-tests can do this!
Creating Bayes models
Given prior assumptions about the behavior of the parameters (the prior), produce a model which tells us the probability of observing our data, to compute new probability of our parameters. Thus the steps for working with a Bayes model are:
- Identify data relevant to the research question: e.g., measurement scales of the data
- Define a descriptive model for the data. For instance, pick a linear model formula or a beta distribution of (2,1)
- Specify a prior distribution of the parameters - this the formalization of the hypothesis. For example, thinking the error in the linear model is normally distributed as 𝑁(𝜃,𝜎²)
- Choose the Bayesian inference formula to compute posterior parameter probabilities
- Update Bayes model if more data is observed. This is key! The posterior distribution naturally updates as more data is added
- Simulate data values from realizations of the posterior distribution of the parameters
Choosing a prior
The choice of the prior distribution is very important to Bayesian analysis. A prior should be convincing to a skeptical audience. Some heuristics to consider are:
- Domain knowledge (SME)
- Prior observations
- If poor knowledge use less informative prior
- Caution: the uniform prior is informative, you need to set the limits on the range of values
One analytically and computationally simple choice is the before mentioned conjugate prior. When a likelihood is multiplied by a conjugate prior the distribution of the posterior is the same as the likelihood. Most named distributions have conjugates:
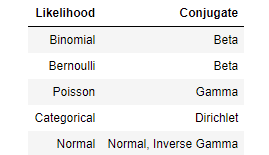 A conjugate prior is not always used
Python Example: COVID-19 random sampling
As a health official for your city, you are interested in analyzing COVID-19 infection rates. You decide to sample 10 people at an intersection while the light is red and determine if they test positive for Covid - the test is fast and to avoid sampling bias we take the test to them. The data are binomially distributed; a person tests positive or tests negative - for the sake of simplicity, assume the test is 100% accurate.
In this notebook example:
- Select a prior for the parameter 𝑝, the probability of having COVID-19.
- Using data, compute the likelihood.
- Compute the posterior and posterior distributions.
- Try another prior distribution.
- Add more data to our data set to updated the posterior distribution.
The likelihood of the data and the posterior distribution are binomially distributed. The binomial distribution has one parameter we need to estimate, 𝑝, the probability. We can write this formally for 𝑘 successes in 𝑁 trials:
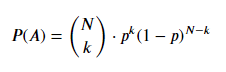 The following code computes some basic summary statistics:
text
sampled = ['yes','no','yes','no','no','yes','no','no','no','yes']
positive = [1 if x is 'yes' else 0 for x in sampled]
positive
 text
N = len(positive) # sample size
n_positive = sum(positive) # number of positive drivers
n_not = N - n_positive # number negative
print('Tested positive= %d Tested negative= %d'
 'nProbability of having COVID-19= %.1f'
 % (n_positive, n_not, n_positive / (n_positive+ n_not)))
 For the prior I will start with a uniform distribution as I do not know what to expect re Covid rates:
text
N = 100
p = np.linspace(.01, .99, num=N)
pp = [1./N] * N
plt.plot(p, pp, linewidth=2, color='blue')
plt.show()
Next step: compute the likelihood. The likelihood is the probability of the data given the parameter, 𝑃(𝑋|𝑝). E ach observation of each test as "positive" or "not" is a Bernoulli trial, so I choose the binomial distribution.
text
def likelihood(p, data):
 k = sum(data)
 N = len(data)
 # Compute Binomial likelihood
 l = scipy.special.comb(N, k) * p**k * (1-p)**(N-k)
 # Normalize the likelihood to sum to unity
 return l/sum(l)
text
l = likelihood(p, positive)
plt.plot(p, l)
plt.title('Likelihood function')
plt.xlabel('Parameter')
plt.ylabel('Likelihood')
plt.show()
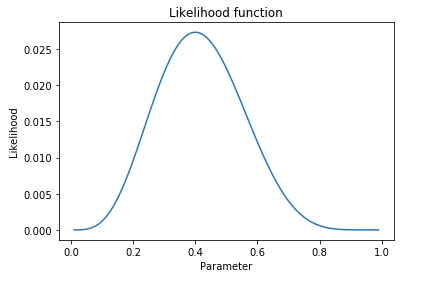 The probability our data is true given our hypothesis
Now that we have a prior and a likelihood we can compute the posterior distribution of the parameter 𝑝: 𝑃**(𝑝|𝑋).**
N.B. The computational methods used here are simplified for the purpose of illustration. Computationally efficient code must be used!
text
def posterior(prior, like):
 post = prior * like # compute the product of the probabilities
 return post / sum(post) # normalize the distribution
text
def plot_post(prior, like, post, x):
 maxy = max(max(prior), max(like), max(post))
 plt.figure(figsize=(12, 4))
 plt.plot(x, like, label='likelihood', linewidth=12, color='black', alpha=.2)
 plt.plot(x, prior, label='prior')
 plt.plot(x, post, label='posterior', color='green')
 plt.ylim(0, maxy)
 plt.xlim(0, 1)
 plt.title('Density of prior, likelihood and posterior')
 plt.xlabel('Parameter value')
 plt.ylabel('Density')
 plt.legend()

post = posterior(pp, l)
plot_post(pp, l, post, p)
 text
print('Maximum of the prior density = %.3f' % max(pp))
print('Maximum likelihood = %.3f' % max(l))
print('MAP = %.3f' % max(post))
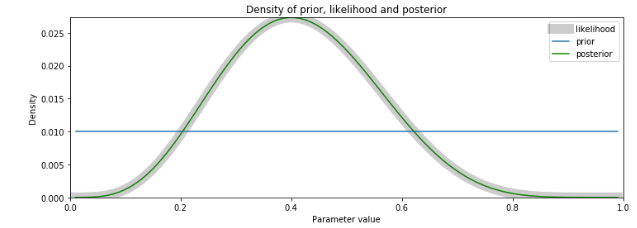
 With a uniform prior distribution, the posterior is just the likelihood. The key point is that the Frequentist probabilities are identical to the Bayesian posterior distribution given a uniform prior.
Trying a different prior
From the chart above, I chose the conjugate prior of the Binomial distribution which is the beta distribution. The beta distribution is defined on the interval 0 ≤ Beta(P|A, B)≤10 ≤ Beta(P|A, B)≤ 1. The beta distribution has two parameters, 𝑎 and 𝑏, which determine the shape.
text
plt.figure(figsize=(12, 8))
text
alpha = [.5, 1, 2, 3, 4]
beta = alpha[:]
x = np.linspace(.001, .999, num=100) #100 samples
text
for i, (a, b) in enumerate(itertools.product(alpha, beta)):
 plt.subplot(len(alpha), len(beta), i+1)
 plt.plot(x, scipy.stats.beta.pdf(x, a, b))
 plt.title('(a, b) = ({}, {})'.format(a,b))
plt.tight_layout()
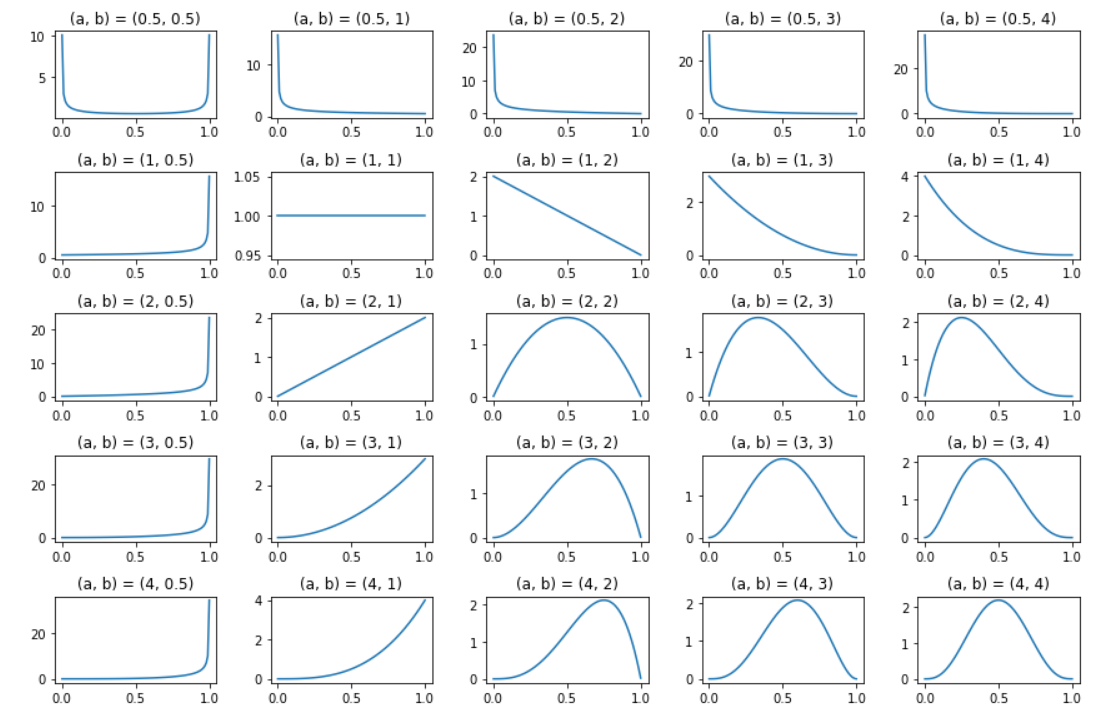 Note how varied these beta distributions can become with slightly different parameters
I still do not know a lot about the behavior of drivers at this intersection who may or may not have COVID-19, so I pick a rather uninformative or broad beta distribution as the prior for the hypothesis. I choose a symmetric prior with a=2 and b=2:
text
def beta_prior(x, a, b):
 l = scipy.stats.beta.pdf(p, a, b) # compute likelihood
 return l / l.sum() # normalize and return
text
pp = beta_prior(p, 2, 2)
post = posterior(pp, l)
plot_post(pp, l, post, p)
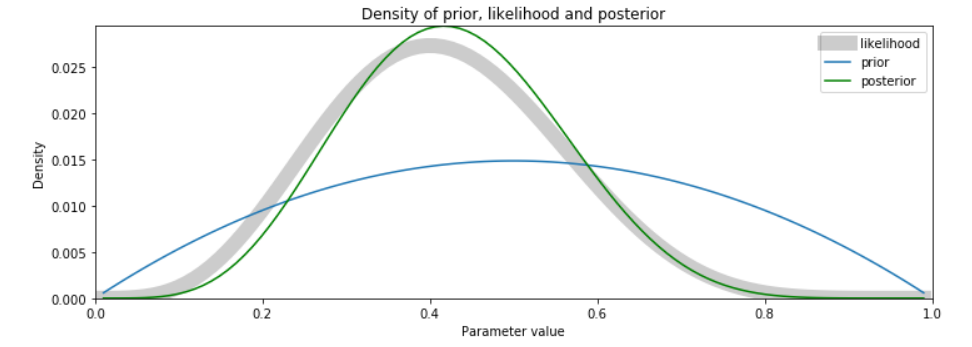 Take note that the mode of the posterior is close to the mode of the likelihood, but has shifted toward the mode of the prior. This behavior of Bayesian posteriors to be shifted toward the prior is known as the shrinkage property: the tendency of the maximum likelihood point of the posterior is said to shrink toward the maximum likelihood point of the prior.
Updating the Bayesian model
Let us update the model with 10 new observations to our data set. Note that the more observations added to the model moves the posterior distribution closer to the likelihood.
N.B. With large datasets, it might require HUGE amounts of data to see convergence in behavior of the posterior and the likelihood.
text
new_samples = ['yes','no','no','no','no',
 'yes','no','yes','no','no'] # new data to update model, n = 20
new_positive = [1 if x is 'yes' else 0 for x in new_samples]
text
l = likelihood(p, positive+ new_positive)
post = posterior(pp, l)
plot_post(pp, l, post, p)
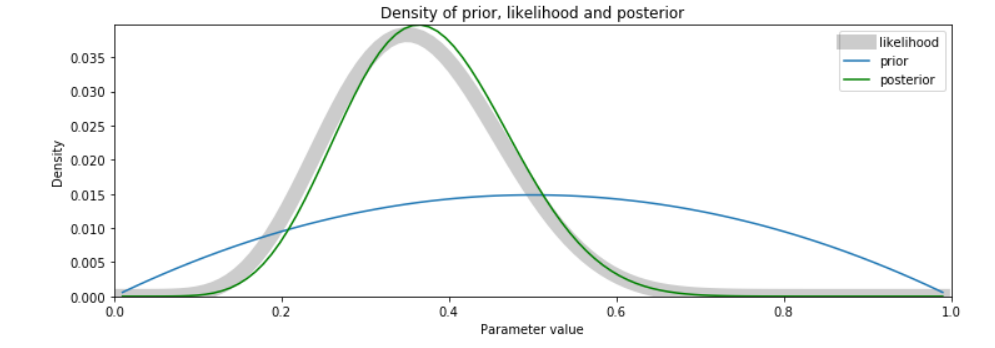 Compared to the first one, note the convergence of the two distributions as we updated with more data
Credible Intervals
A credible interval is an interval on the Bayesian posterior distribution. The credible interval is sometimes called the highest density interval (HDI). For instance, the 90% credible interval encompasses 90% of the posterior distribution with the highest probability density. It can be confusing since both credible intervals of Bayesian and confidence intervals of Frequentist are abbreviated the same (CI).
Luckily, the credible interval is the Bayesian analog of the Frequentist confidence interval. However, they are conceptually different. The confidence interval is chosen on the distribution of a test statistic, whereas the credible interval is computed on the posterior distribution of the parameter. For symmetric distributions, the credible interval can be numerically the same as the confidence interval. However, in the general case, these two quantities can be quite different.
Now we plot the posterior distribution of the parameter of the binomial distribution parameter p. The 95% credible interval, or HDI, is also computed and displayed:
text
num_samples = 100000
lower_q, upper_q = [.025, .975]
text
# Caution, this code assumes a symmetric prior distribution and will not work in the general case
text
def plot_ci(p, post, num_samples, lower_q, upper_q):
 # Compute a large sample by resampling with replacement
 samples = np.random.choice(p, size=num_samples, replace=True, p=post)
 ci = scipy.percentile(samples, [lower_q*100, upper_q*100]) # compute the quantiles

 interval = upper_q - lower_q
 plt.title('Posterior density with %.3f credible interval' % interval)
 plt.plot(p, post, color='blue')
 plt.xlabel('Parameter value')
 plt.ylabel('Density')
 plt.axvline(x=ci[0], color='red')
 plt.axvline(x=ci[1], color='red')
 print('The %.3f credible interval is %.3f to %.3f'
 % (interval, lower_q, upper_q))

plot_ci(p, post, num_samples, lower_q, upper_q)
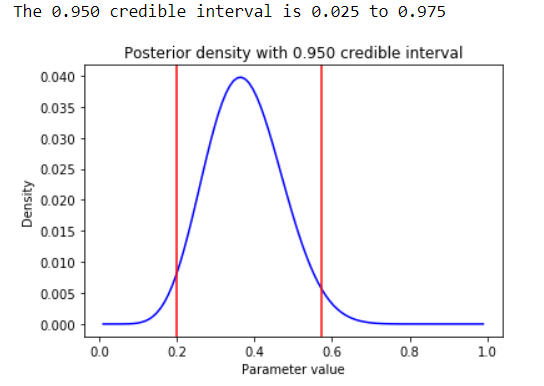 Because the posterior distribution above is symmetric , like the beta prior we chose, the analysis is identical to CI's in the frequentist approach. We can be 95% confident that around 40% of driver's tested at this intersection during a red light will have COVID-19! This info is very useful for health agencies to allocate resources appropriately.
If you remember the joke in the third paragraph, about the Bayesian who vaguely suspected a horse and caught a fleeting glimpse of a donkey and strongly suspects seeing a mule - I hope you can now assign each clause of the joke the appropriate part Bayes theorem.
Check out my next piece on linear regression and using bootstrap with regression models.
Find me on Linkedin
Physicist cum Data Scientist- Available for new opportunity | SaaS | Sports | Start-ups | Scale-ups
Register Now to Continue Reading
Unlock Towards Data Science with a Free Account
All articles on Towards Data Science are available to registered users. Create a free account today to access this article and thousands more.
Register for freeSign in to your account
 Written By
See all from James Andrew Godwin
Editor's PicksBayes TheoremBayesian StatisticsData ScienceGetting Started
Share This Article
Towards Data Science is a community publication. Submit your insights to reach our global audience and earn through the TDS Author Payment Program.
Write for TDS
Related Articles
Artificial Intelligence
How to implement semantic chunking and gain better results.
Thuwarakesh Murallie
August 22, 202411 min read
Machine Learning
And how you can start
Patrick Brus
September 28, 20227 min read
Data Science
Using Seattle's local retail store data for consumer patterns of the lottery (SQL, Python)
Sung Ahn
January 4, 202512 min read
Artificial Intelligence
Implementing Machine Learning Classification Algorithms to Recognize Handwritten Digits
Mahnoor Javed
November 21, 20208 min read
Data Science
Using Streamlit to develop dynamically updated data visualizations
Mohammad Khorasani
December 4, 20203 min read
Large Language Models
Set up and run the GPQA-Diamond benchmark on DeepSeek-R1's distilled models locally to evaluate its reasoning capabilities.
Kenneth Leung
April 23, 20253 min read
Data Science
Peer Review and Definition of Done: Small Changes, BIG Impact
Jon Loyens
October 4, 20217 min read
Artificial Intelligence
Based on 10,000+ hours of experience and many failures!
Sharan Kumar Ravindran
July 29, 202210 min read
Data Science
How to gather data about scientific literature and discover trends
Jozsef Meszaros
May 19, 202316 min read
Your home for data science and AI. The world's leading publication for data science, data analytics, data engineering, machine learning, and artificial intelligence professionals.
Subscribe to Our NewsletterWrite For TDS•About•Advertise•Privacy Policy•Terms of Use
© Insight Media Group, LLC 2026•The New Stack•roadmap.sh•Creator Network
Recommended Articles
Close