保留正文与补采附件。源页面当前未重新核验;具体限制见交付清单。
 We value your privacy
We use cookies to enhance your browsing experience, serve personalised ads or content, and analyse our traffic. By clicking "Accept All", you consent to our use of cookies.
Customise Reject All Accept All
Customise Consent Preferences
 We use cookies to help you navigate efficiently and perform certain functions. You will find detailed information about all cookies under each consent category below.
The cookies that are categorised as "Necessary" are stored on your browser as they are essential for enabling the basic functionalities of the site. ... Show more
NecessaryAlways Active
Necessary cookies are required to enable the basic features of this site, such as providing secure log-in or adjusting your consent preferences. These cookies do not store any personally identifiable data.
-
Cookie
BCTempID
-
Duration
10 minutes
-
Description
No description available.
-
Cookie
__cf_bm
-
Duration
1 hour
-
Description
This cookie, set by Cloudflare, is used to support Cloudflare Bot Management.
-
Cookie
AWSALBCORS
-
Duration
7 days
-
Description
Amazon Web Services set this cookie for load balancing.
-
Cookie
_cfuvid
-
Duration
session
-
Description
Cloudflare sets this cookie to track users across sessions to optimize user experience by maintaining session consistency and providing personalized services
-
Cookie
li_gc
-
Duration
6 months
-
Description
Linkedin set this cookie for storing visitor's consent regarding using cookies for non-essential purposes.
-
Cookie
__hssrc
-
Duration
session
-
Description
This cookie is set by Hubspot whenever it changes the session cookie. The __hssrc cookie set to 1 indicates that the user has restarted the browser, and if the cookie does not exist, it is assumed to be a new session.
-
Cookie
__hssc
-
Duration
1 hour
-
Description
HubSpot sets this cookie to keep track of sessions and to determine if HubSpot should increment the session number and timestamps in the __hstc cookie.
-
Cookie
wpEmojiSettingsSupports
-
Duration
session
-
Description
WordPress sets this cookie when a user interacts with emojis on a WordPress site. It helps determine if the user's browser can display emojis properly.
-
Cookie
BCSessionID
-
Duration
1 year 1 month 4 days
-
Description
Blueconic sets this cookie as a unique identifier for the BlueConic profile.
-
Cookie
_octo
-
Duration
1 year
-
Description
No description available.
-
Cookie
logged_in
-
Duration
1 year
-
Description
No description available.
-
Cookie
__Secure-YEC
-
Duration
past
-
Description
YouTube sets this cookie to stores the user's video player preferences using embedded YouTube video
-
Cookie
__eoi
-
Duration
6 months
-
Description
Description is currently not available.
-
Cookie
AWSALBTGCORS
-
Duration
7 days
-
Description
No description available.
-
Cookie
login-status-p
-
Duration
past
-
Description
Description is currently not available.
-
Cookie
AWSALBTG
-
Duration
7 days
-
Description
No description available.
-
Cookie
csrf_token
-
Duration
session
-
Description
No description available.
-
Cookie
token_v2
-
Duration
1 day
-
Description
Description is currently not available.
-
Cookie
D
-
Duration
1 year
-
Description
Description is currently not available.
-
Cookie
PHPSESSID
-
Duration
session
-
Description
This cookie is native to PHP applications. The cookie stores and identifies a user's unique session ID to manage user sessions on the website. The cookie is a session cookie and will be deleted when all the browser windows are closed.
-
Cookie
VISITOR_PRIVACY_METADATA
-
Duration
6 months
-
Description
YouTube sets this cookie to store the user's cookie consent state for the current domain.
-
Cookie
cookietest
-
Duration
session
-
Description
The cookietest cookie is typically used to determine whether the user's browser accepts cookies, essential for website functionality and user experience.
-
Cookie
__Host-airtable-session
-
Duration
1 year
-
Description
This cookie is used to enable us to integrate the services of Airtable.
-
Cookie
__Host-airtable-session.sig
-
Duration
1 year
-
Description
This cookie is used to enable us to integrate the services of Airtable.
-
Cookie
m
-
Duration
1 year 1 month 4 days
-
Description
Stripe sets this cookie for fraud prevention purposes. It identifies the device used to access the website, allowing the website to be formatted accordingly.
-
Cookie
BIGipServer*
-
Duration
session
-
Description
Marketo sets this cookie to collect information about the user's online activity and build a profile about their interests to provide advertisements relevant to the user.
-
Cookie
__cfruid
-
Duration
session
-
Description
Cloudflare sets this cookie to identify trusted web traffic.
-
Cookie
_GRECAPTCHA
-
Duration
6 months
-
Description
Google Recaptcha service sets this cookie to identify bots to protect the website against malicious spam attacks.
-
Cookie
__Secure-YNID
-
Duration
6 months
-
Description
Google cookie used to protect user security and prevent fraud, especially during the login process.
-
Cookie
cookieyes-consent
-
Duration
1 year
-
Description
CookieYes sets this cookie to remember users' consent preferences so that their preferences are respected on subsequent visits to this site. It does not collect or store any personal information about the site visitors.
Functional
Functional cookies help perform certain functionalities like sharing the content of the website on social media platforms, collecting feedback, and other third-party features.
-
Cookie
lidc
-
Duration
1 day
-
Description
LinkedIn sets the lidc cookie to facilitate data center selection.
-
Cookie
brw
-
Duration
1 year
-
Description
No description available.
-
Cookie
brwConsent
-
Duration
5 minutes
-
Description
Description is currently not available.
-
Cookie
WMF-Uniq
-
Duration
1 year
-
Description
Description is currently not available.
-
Cookie
loom_anon_comment
-
Duration
1 year
-
Description
No description available.
-
Cookie
loom_referral_video
-
Duration
session
-
Description
Description is currently not available.
-
Cookie
VISITOR_INFO1_LIVE
-
Duration
6 months
-
Description
A cookie set by YouTube to measure bandwidth that determines whether the user gets the new or old player interface.
-
Cookie
yt-remote-connected-devices
-
Duration
Never Expires
-
Description
YouTube sets this cookie to store the user's video preferences using embedded YouTube videos.
-
Cookie
ytidb::LAST_RESULT_ENTRY_KEY
-
Duration
Never Expires
-
Description
The cookie ytidb::LAST_RESULT_ENTRY_KEY is used by YouTube to store the last search result entry that was clicked by the user. This information is used to improve the user experience by providing more relevant search results in the future.
-
Cookie
yt-remote-device-id
-
Duration
Never Expires
-
Description
YouTube sets this cookie to store the user's video preferences using embedded YouTube videos.
-
Cookie
yt-remote-session-name
-
Duration
session
-
Description
The yt-remote-session-name cookie is used by YouTube to store the user's video player preferences using embedded YouTube video.
-
Cookie
yt-remote-fast-check-period
-
Duration
session
-
Description
The yt-remote-fast-check-period cookie is used by YouTube to store the user's video player preferences for embedded YouTube videos.
-
Cookie
yt-remote-session-app
-
Duration
session
-
Description
The yt-remote-session-app cookie is used by YouTube to store user preferences and information about the interface of the embedded YouTube video player.
-
Cookie
yt-remote-cast-available
-
Duration
session
-
Description
The yt-remote-cast-available cookie is used to store the user's preferences regarding whether casting is available on their YouTube video player.
-
Cookie
yt-remote-cast-installed
-
Duration
session
-
Description
The yt-remote-cast-installed cookie is used to store the user's video player preferences using embedded YouTube video.
-
Cookie
cp_session
-
Duration
3 months
-
Description
Codepen sets this cookie for Help systems found in the website.
-
Cookie
loid
-
Duration
1 year 1 month 4 days
-
Description
This cookie is set by the Reddit. The cookie enables the sharing of content from the website onto the social media platform.
Analytics
Analytical cookies are used to understand how visitors interact with the website. These cookies help provide information on metrics such as the number of visitors, bounce rate, traffic source, etc.
-
Cookie
__hstc
-
Duration
6 months
-
Description
Hubspot set this main cookie for tracking visitors. It contains the domain, initial timestamp (first visit), last timestamp (last visit), current timestamp (this visit), and session number (increments for each subsequent session).
-
Cookie
hubspotutk
-
Duration
6 months
-
Description
HubSpot sets this cookie to keep track of the visitors to the website. This cookie is passed to HubSpot on form submission and used when deduplicating contacts.
-
Cookie
_ga
-
Duration
1 year 1 month 4 days
-
Description
Google Analytics sets this cookie to calculate visitor, session and campaign data and track site usage for the site's analytics report. The cookie stores information anonymously and assigns a randomly generated number to recognise unique visitors.
-
Cookie
ga*
-
Duration
1 year 1 month 4 days
-
Description
Google Analytics sets this cookie to store and count page views.
-
Cookie
__Host-psifi.analyticsTrace
-
Duration
6 hours
-
Description
Description is currently not available.
-
Cookie
__Host-psifi.analyticsTraceV2
-
Duration
6 hours
-
Description
Description is currently not available.
-
Cookie
_gh_sess
-
Duration
session
-
Description
GitHub sets this cookie for temporary application and framework state between pages like what step the user is on in a multiple step form.
-
Cookie
YSC
-
Duration
session
-
Description
YSC cookie is set by Youtube and is used to track the views of embedded videos on Youtube pages.
-
Cookie
ajs_anonymous_id
-
Duration
1 year
-
Description
This cookie is set by Segment to count the number of people who visit a certain site by tracking if they have visited before.
-
Cookie
vuid
-
Duration
1 year 1 month 4 days
-
Description
Vimeo installs this cookie to collect tracking information by setting a unique ID to embed videos on the website.
Performance
Performance cookies are used to understand and analyse the key performance indexes of the website which helps in delivering a better user experience for the visitors.
-
Cookie
AWSALB
-
Duration
7 days
-
Description
AWSALB is an application load balancer cookie set by Amazon Web Services to map the session to the target.
-
Cookie
acq
-
Duration
past
-
Description
Description is currently not available.
-
Cookie
acq.sig
-
Duration
past
-
Description
Description is currently not available.
-
Cookie
ptc
-
Duration
2 years
-
Description
No description available.
Advertisement
Advertisement cookies are used to provide visitors with customised advertisements based on the pages you visited previously and to analyse the effectiveness of the ad campaigns.
-
Cookie
muc_ads
-
Duration
1 year 1 month 4 days
-
Description
Twitter sets this cookie to collect user behaviour and interaction data to optimize the website.
-
Cookie
guest_id_marketing
-
Duration
1 year 1 month 4 days
-
Description
Twitter sets this cookie to identify and track the website visitor.
-
Cookie
guest_id_ads
-
Duration
1 year 1 month 4 days
-
Description
Twitter sets this cookie to identify and track the website visitor.
-
Cookie
personalization_id
-
Duration
1 year 1 month 4 days
-
Description
Twitter sets this cookie to integrate and share features for social media and also store information about how the user uses the website, for tracking and targeting.
-
Cookie
guest_id
-
Duration
1 year 1 month 4 days
-
Description
Twitter sets this cookie to identify and track the website visitor. It registers if a user is signed in to the Twitter platform and collects information about ad preferences.
-
Cookie
bcookie
-
Duration
1 year
-
Description
LinkedIn sets this cookie from LinkedIn share buttons and ad tags to recognize browser IDs.
-
Cookie
__Secure-ROLLOUT_TOKEN
-
Duration
6 months
-
Description
YouTube sets this cookie to manage feature rollout and experimentation. It helps Google control which new features or interface changes are shown to users as part of testing and staged rollouts, ensuring consistent experience for a given user during an experiment.
-
Cookie
yt.innertube::nextId
-
Duration
Never Expires
-
Description
YouTube sets this cookie to register a unique ID to store data on what videos from YouTube the user has seen.
-
Cookie
yt.innertube::requests
-
Duration
Never Expires
-
Description
YouTube sets this cookie to register a unique ID to store data on what videos from YouTube the user has seen.
-
Cookie
session_tracker
-
Duration
session
-
Description
This cookie is set by the Reddit. This cookie is used to identify trusted web traffic. It also helps in adverstising on the website.
-
Cookie
edgebucket
-
Duration
session
-
Description
Reddit sets this cookie to save the information about a log-on Reddit user, for the purpose of advertisement recommendations and updating the content.
-
Cookie
did
-
Duration
1 year
-
Description
Arbor sets this cookie to show targeted ads to site visitors.This cookie expires after 2 months or 1 year.
Uncategorised
Other uncategorised cookies are those that are being analysed and have not been classified into a category as yet.
No cookies to display.
Reject All Save My Preferences Accept All
Toggle SearchToggle Mobile Navigation
Publish AI, ML & data-science insights to a global community of data professionals.
Sign inSubmit an Article
LatestEditor's PicksNewsletterShipAI
Write For TDS
LinkedInXToggle Search
Data Science
Manufacturing data analytics with Python: A hands-on example
We show how we can handle a typical manufacturing data analytics problem of machine/tester drift and benchmark using Python tools.
Tirthajyoti Sarkar
October 28, 20219 min read
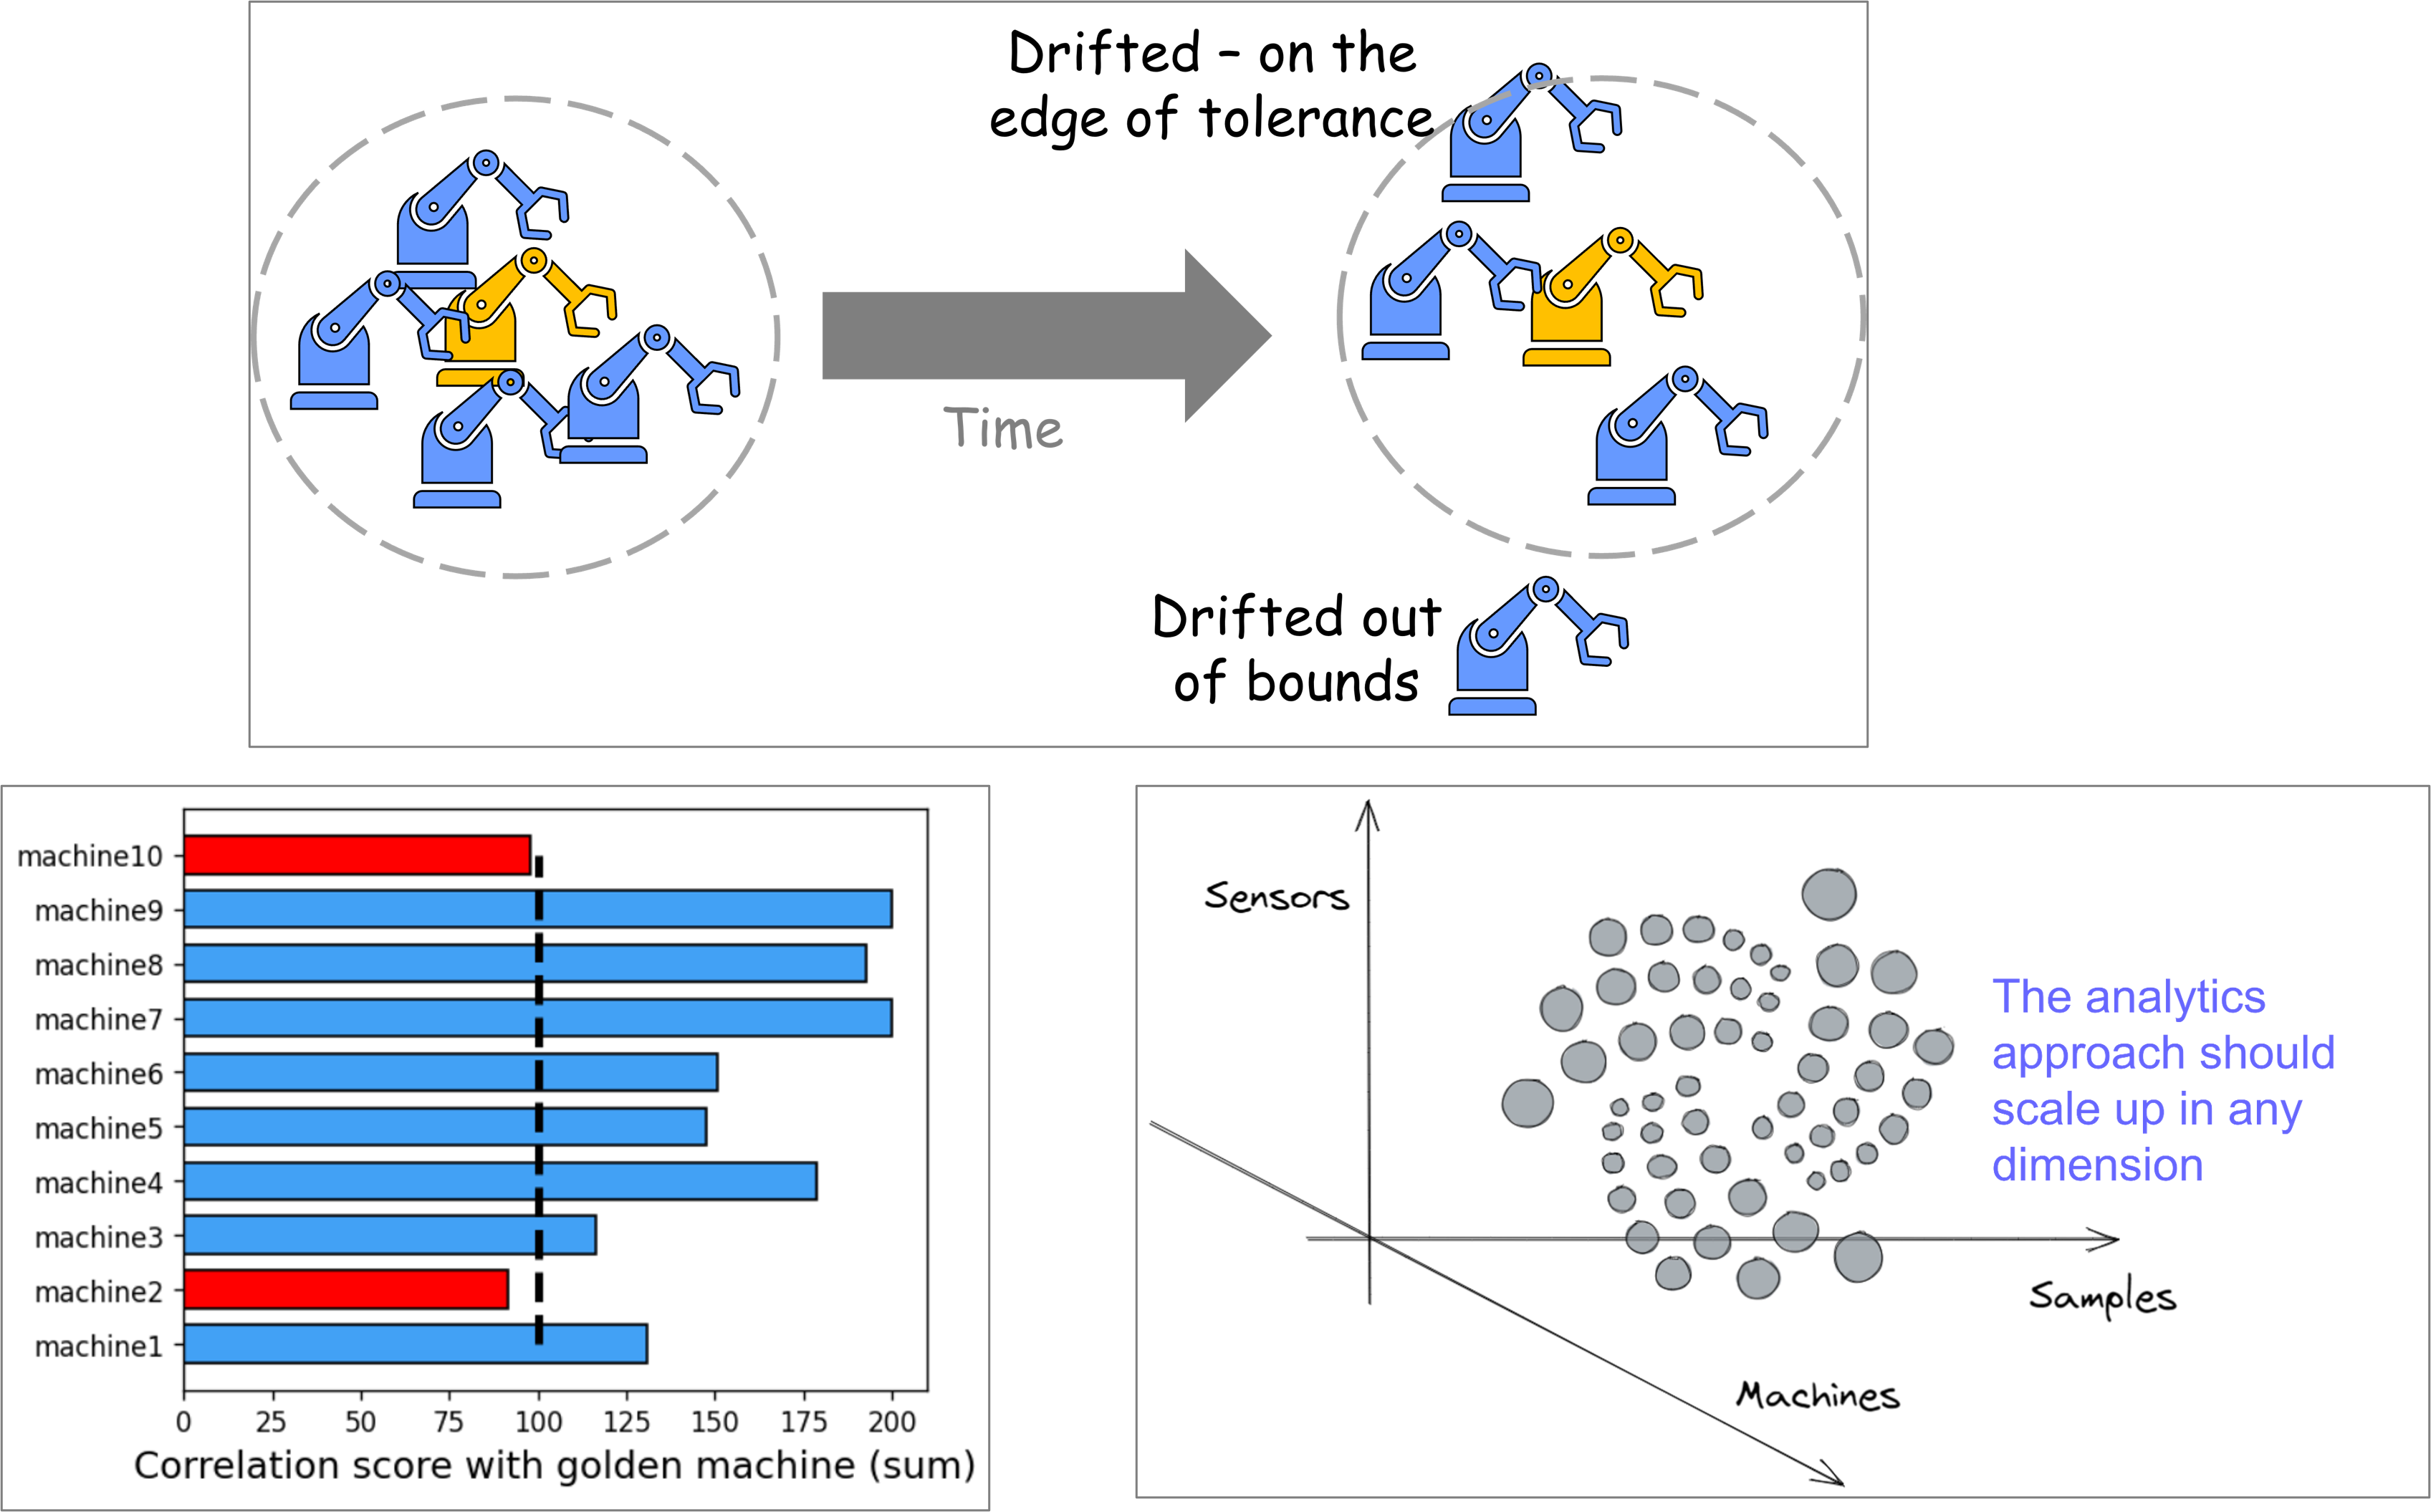 Image source: Created by the author
Learn this step by step with the interactive AI and Data Scientist and Machine Learning roadmaps.
Data analytics to solve manufacturing problems
Before transitioning into the career of Data Science (DS) and Machine Learning (ML), I spent more than a decade as a Semiconductor Technologist and designer in the tech industry of Silicon Valley. I was part of the organizations that had massive manufacturing footprints - front-end wafer fabs, back-end assembly facilities, etc.
We had great successes in launching high-performance products and developing novel technology nodes. We also had our fair share of manufacturing issues. I always maintained that many of these problems can be better analyzed and solved using the modern tools of DS and ML.
And, of course, it is just not me. A lot of clever folks are talking about it too.
Top 8 Data Science Use Cases in Manufacturing - KDnuggets
Naturally, after I moved into the world of data science, I have often been asked to illustrate how common manufacturing analytics problems can be solved with quick programming tools and techniques that can be used by anybody. In this brief article, I try to showcase one specific example - the drift issue with machines and testers.
The machine/tester drift problem
Modern manufacturing plants employ enormously complex machines and equipment for production, packaging, testing, etc. Although designed for high quality and stability, no machine is immune to drift and variance. Over time, sub-components start to behave slightly differently than what they did in the installation phase, and the overall characteristic drifts.
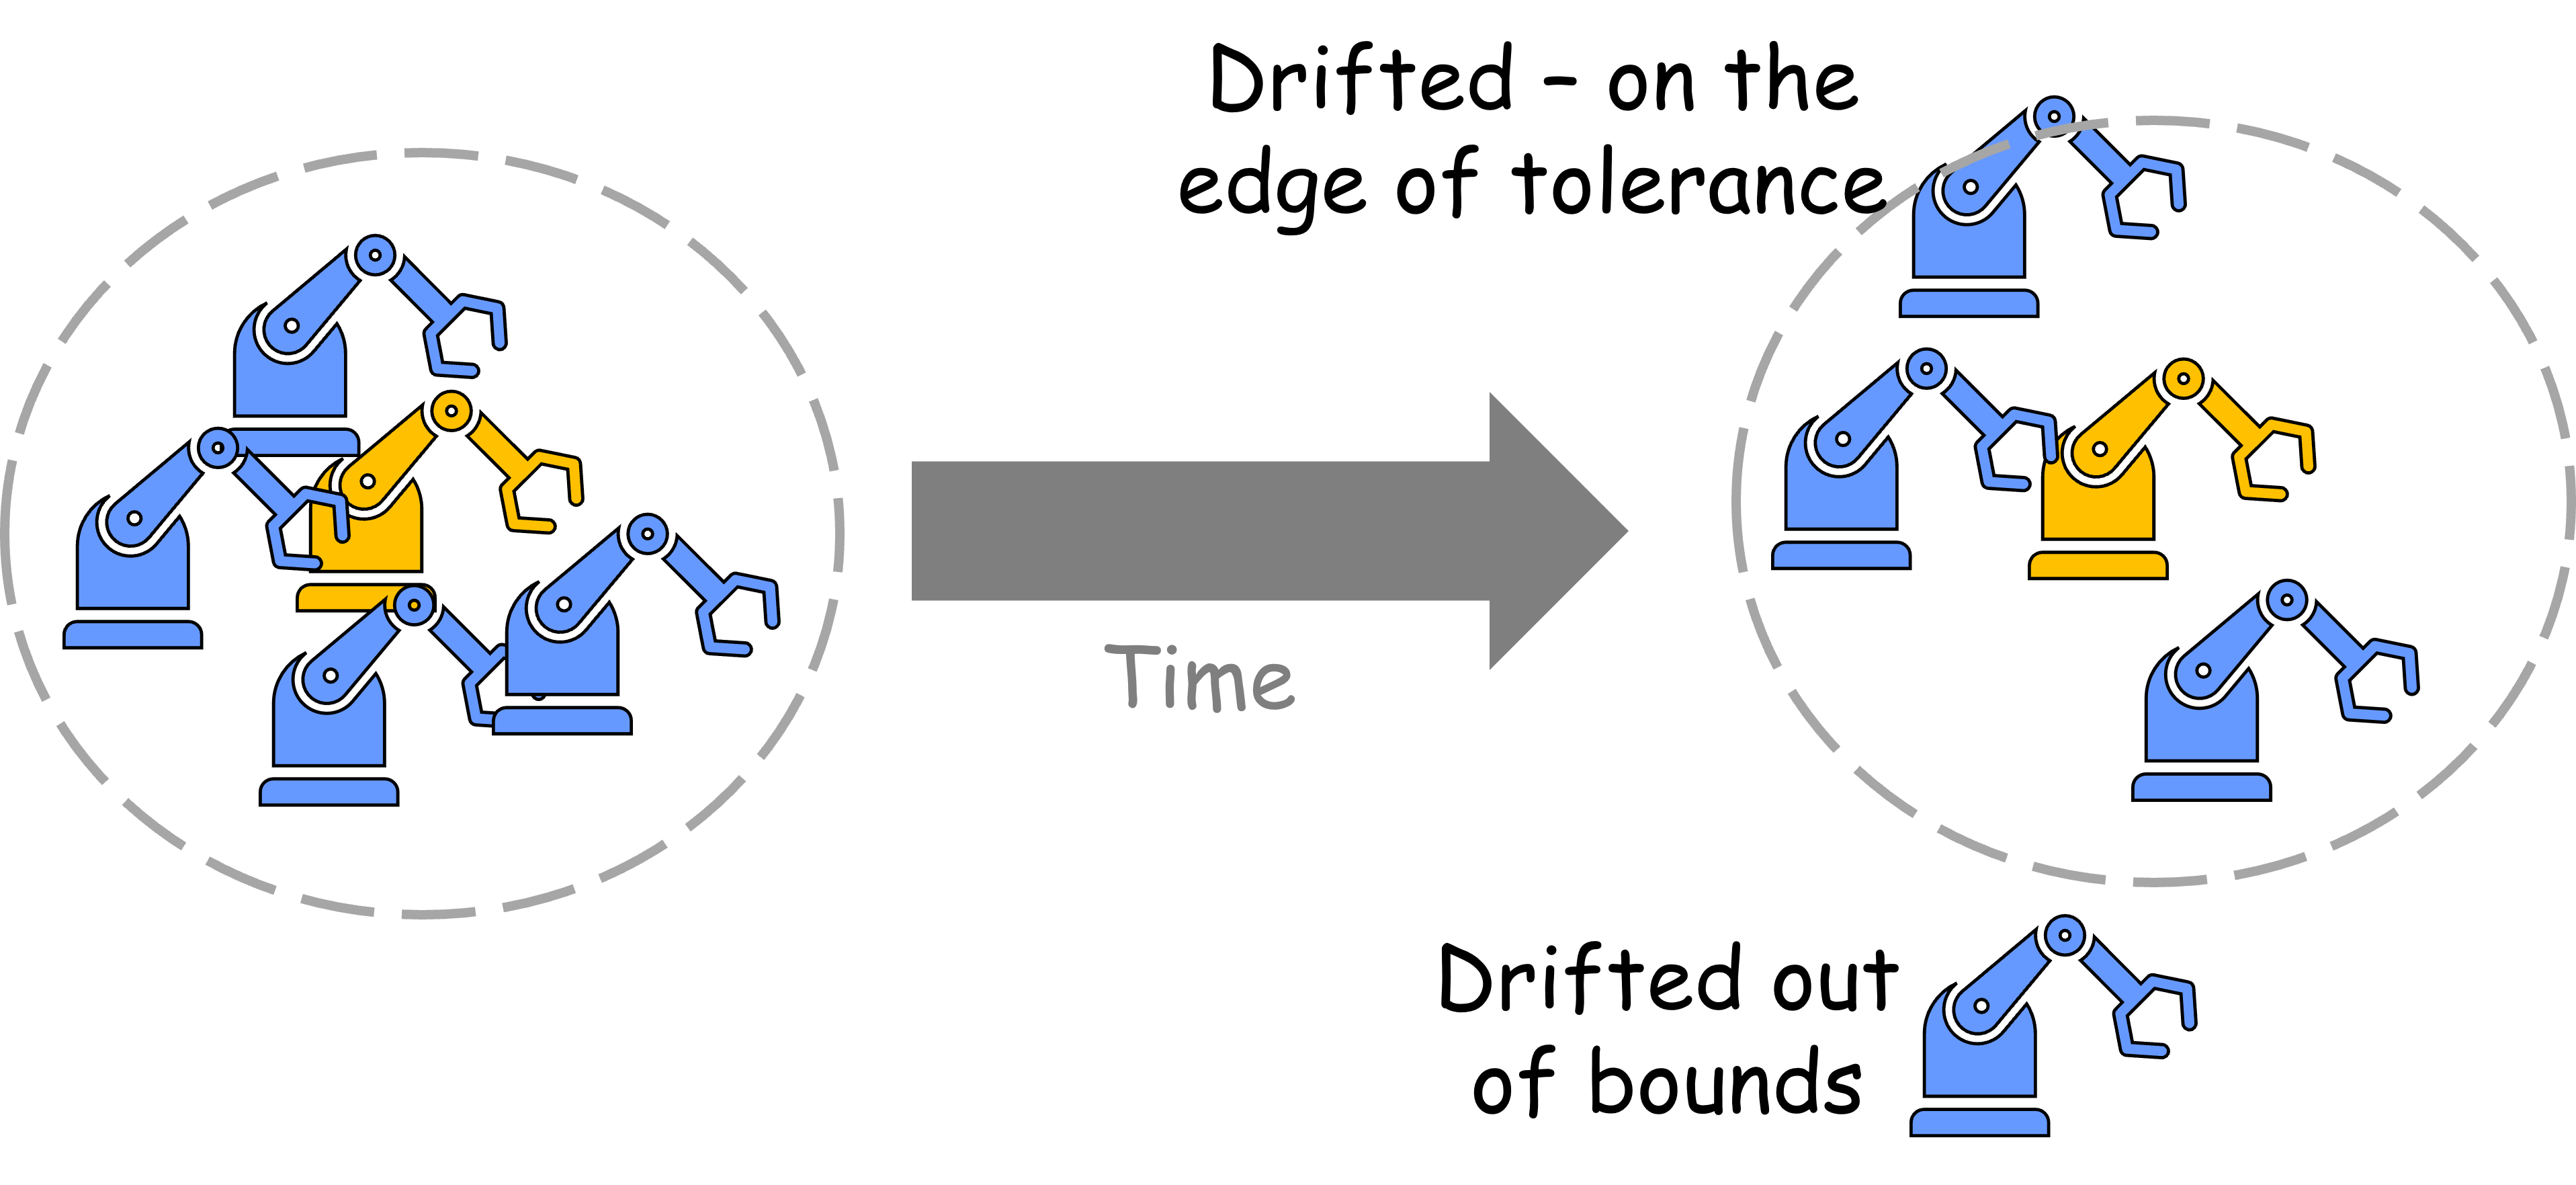 Image source: Created by the author
Detecting this drift is important for many reasons,
- to identify which machine (among a set of them) may require repair and maintenance
- to correct/reset the drift by software or hardware intervention
- to correlate product quality with the machine drift
- to investigate yield issues or reliability failures that might have been caused by the machine drift and increased variance
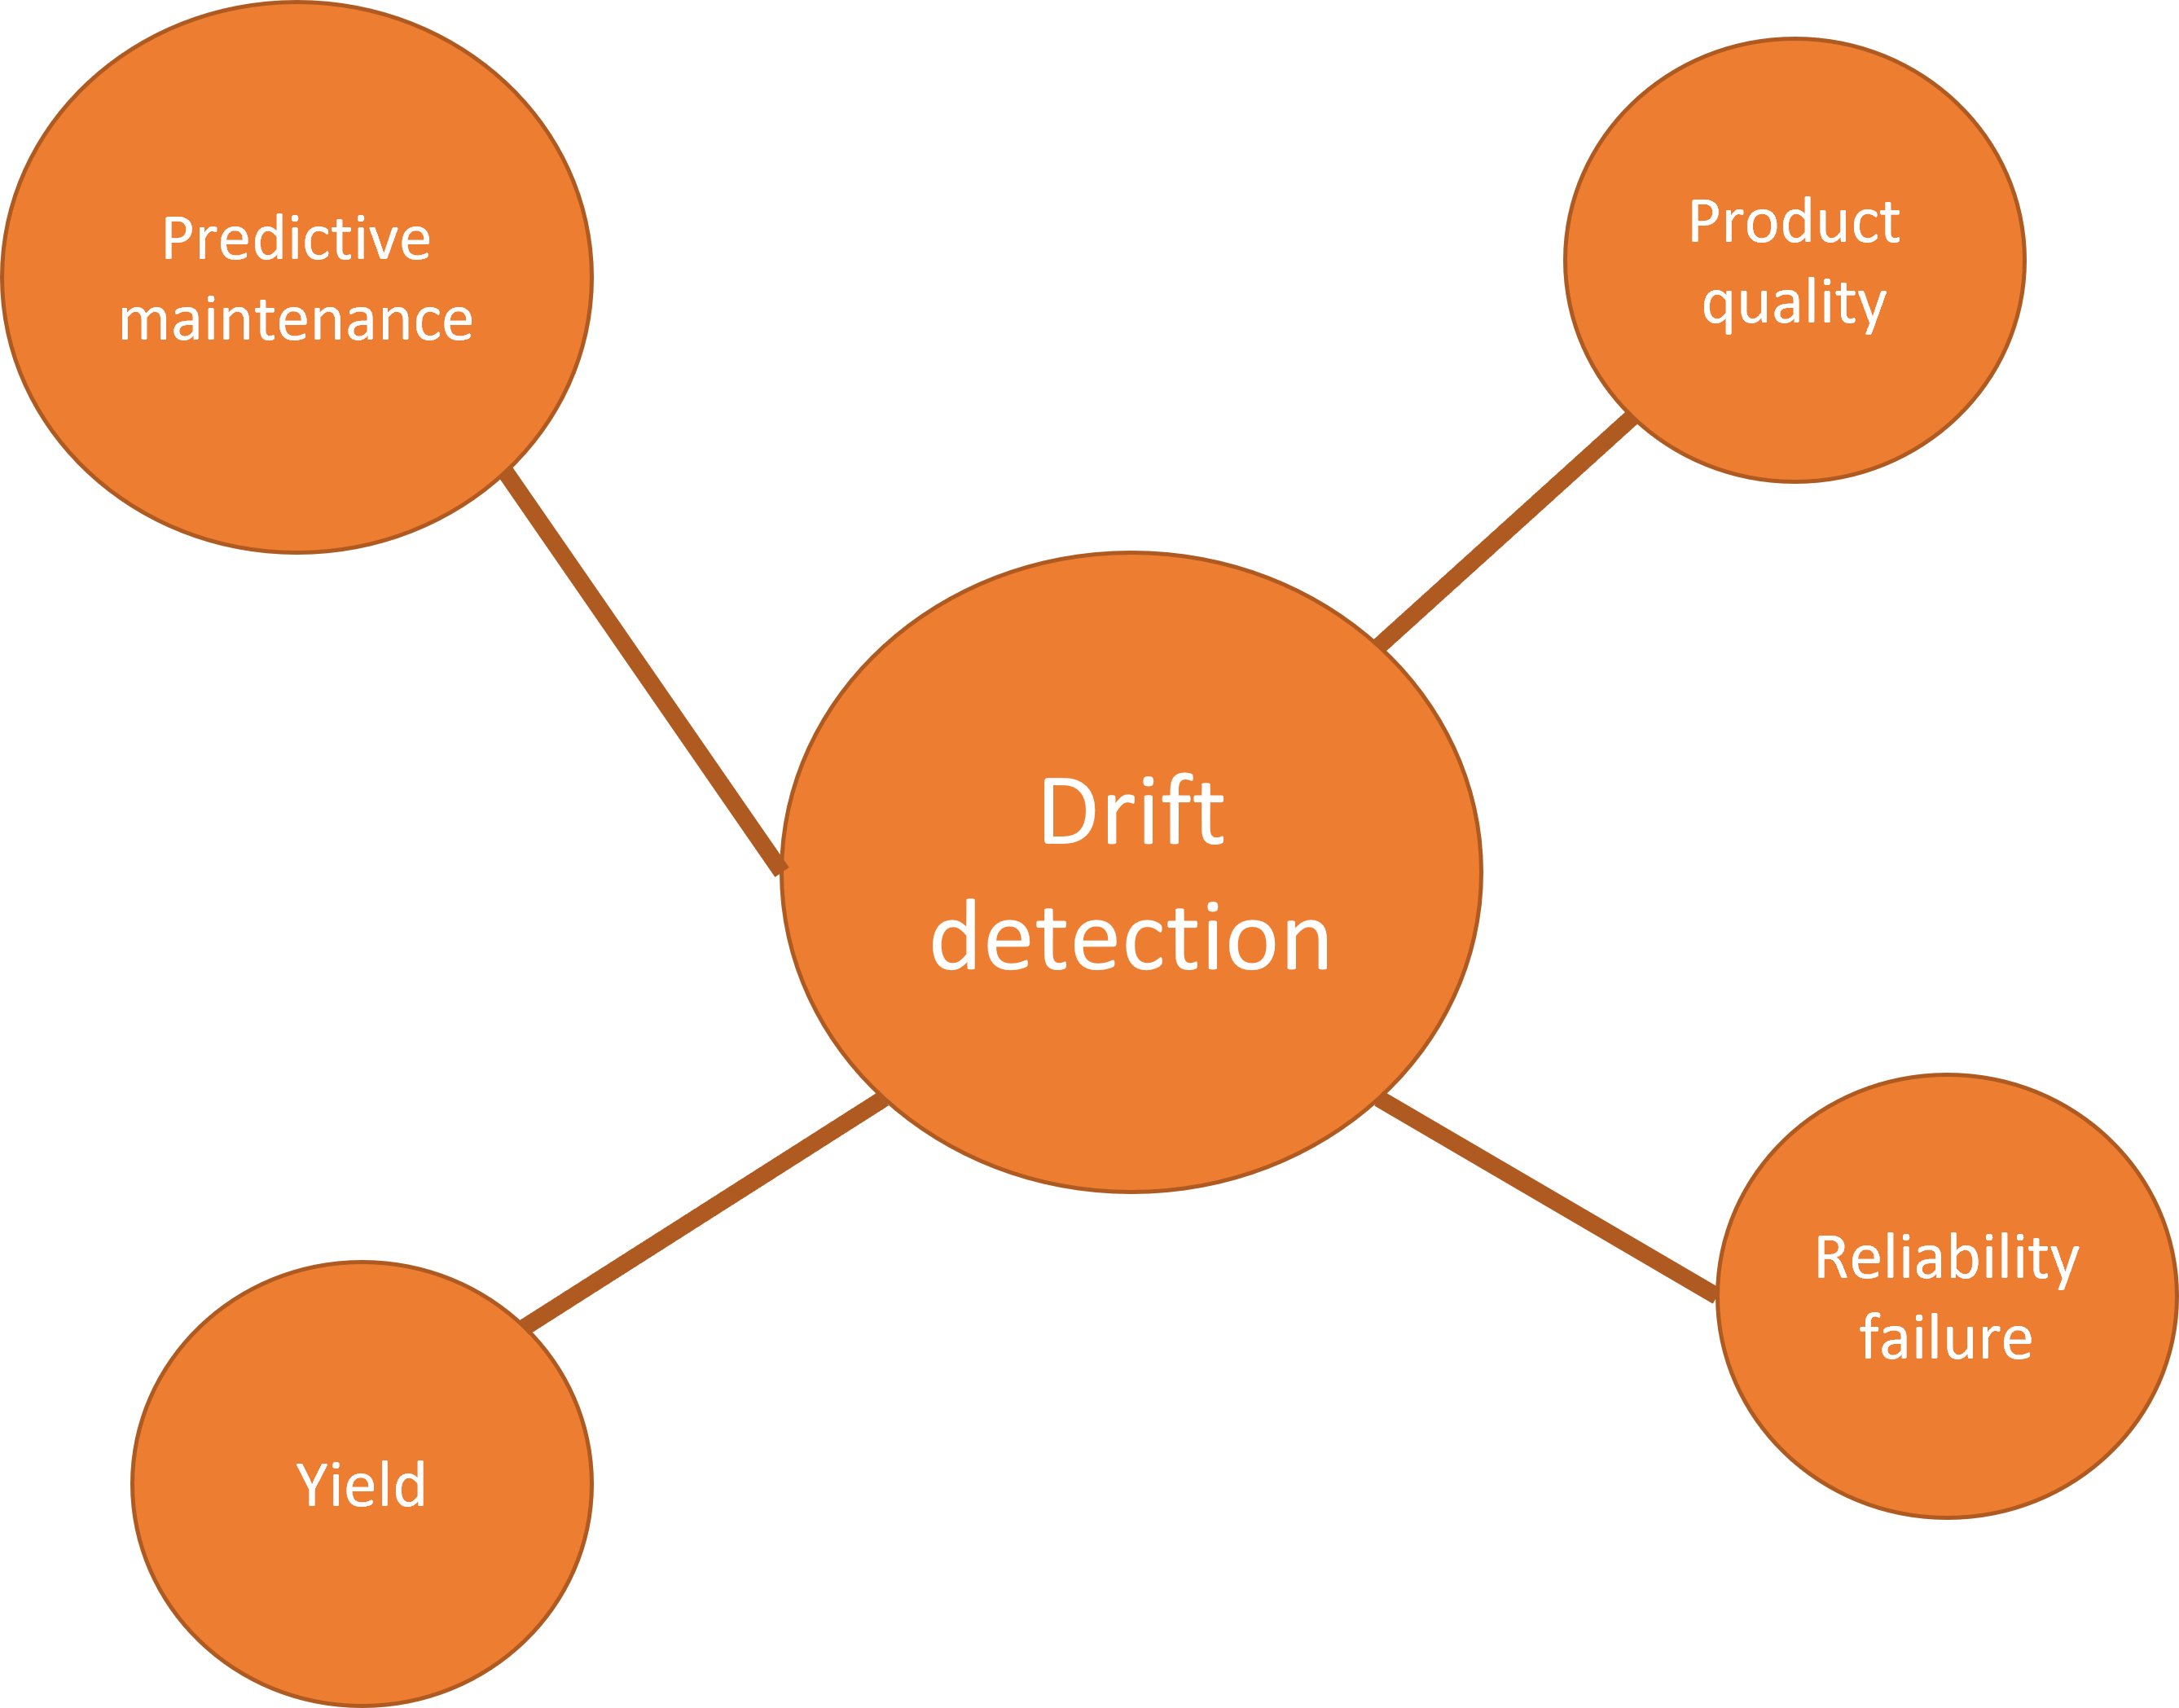 Image source: Created by the author
Individual drift detection
Detecting drift and change for an individual piece of equipment is a common manufacturing problem. This can be handled using various approaches, especially if some sort of test/sensor data is also available. A few approaches are,
- looking for and counting anomalies in the process - if their density exceeds a threshold, then the machine might need repair/maintenance
- monitoring the statistical distribution (not necessarily Normal/Gaussian) of the data associated with a machine and detecting when that changes
- performing some sort of simple statistical tests (e.g. comparing means to a golden standard machine) every day/week and detecting if there is a significant change
Although designed for high quality and stability, no machine is immune to drift and variance.
Which machines are falling out most?
Often, the most prudent task is to identify the machines (among a set of many identical machines) that are drifting most compared to a golden standard. Ideally, we want to rank them by assigning some sort of numerical score.
This is often practiced in real-life scenarios. Why? Because previous experience and data analytics might have shown that a small drift does not impact the product quality or yield, and only the machines which have drifted most should be stopped for intervention and maintenance.
Business managers and manufacturing VPs will tell you that intervention costs money and should only be done when unavoidable. Your data analytics, they expect, will guide them on the most pressing problems, and not just throw general statistical analyses and charts at them.
Not a trivial data problem
With all the hype around Industry 4.0 , Digital Transformation , and Smart Manufacturing , you will be surprised to know that the most significant hindrance in the path of such transformative changes is still the basic data collection and ingestion.
Machine move, operations are executed, products are generated. But, most often, they are not digitally recorded. If they are not properly recorded (just in time), the associated data is lost to the Universe, contributing to the ever-increasing Entropy. They are not useful for any subsequent data-driven analytics pipeline.
Often, the most prudent task is to identify the machines (among a set of many identical machines) that are drifting most compared to a golden standard.
This is a whole new discussion and we will set it aside for another future article. Let's assume we can capture sensor/process data associated with a set of machines as they operate. Moreover, this data is well-structured and clean. Even then, the solution to the drift detection is not trivial.
Let's say,
- we collect 200 samples' measurements per machine
- there are 10 process measurements (or sensors) - A , B , C , etc.
- there are 10 machines - _M_1, _M_2, _M_3, etc.
- there is, of course, a golden machine, with which we want to benchmark all these 10 machines and detect drift
So, we have a nice table of 20,000 data points (plus the golden machine data). But each measurement is different in nature and does not correlate to each other. The measurement from sensor 'A ' in machine '_M_1' correlates to the measurement of sensor 'A ' from machine '_M_2', or that from the machine '_M_3'. The following figure illustrates the idea.
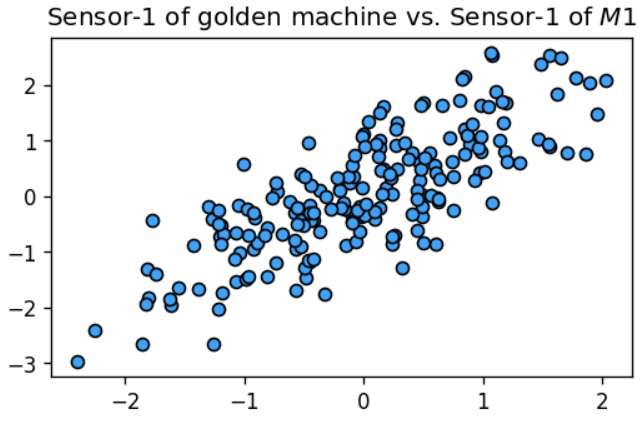
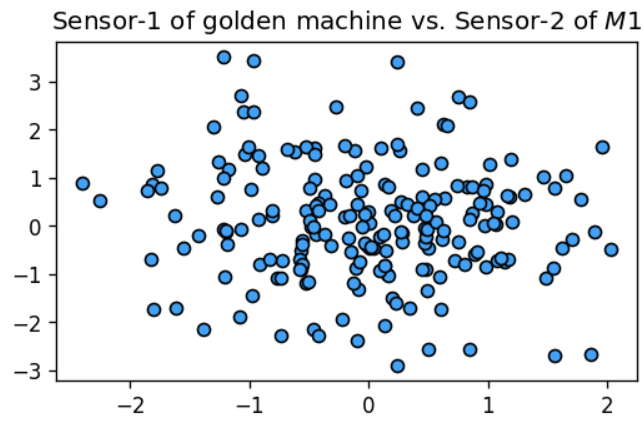 Image source : Created by the author
Machine move, operations are executed, products are generated. But, most often, they are not digitally recorded. If they are not properly recorded (just in time), the associated data is lost to the Universe, contributing to the ever-increasing Entropy.
Not a trivial cognitive load either
Analytics dashboards are extremely popular in the manufacturing industry, especially among plant managers. They have their utility - in many situations - portraying a holistic picture of the health of the production process.
However, in this particular case, if you try to visualize every sensor measurement and find out the degree of correlation, you will encounter a maze of plots and nothing useful.
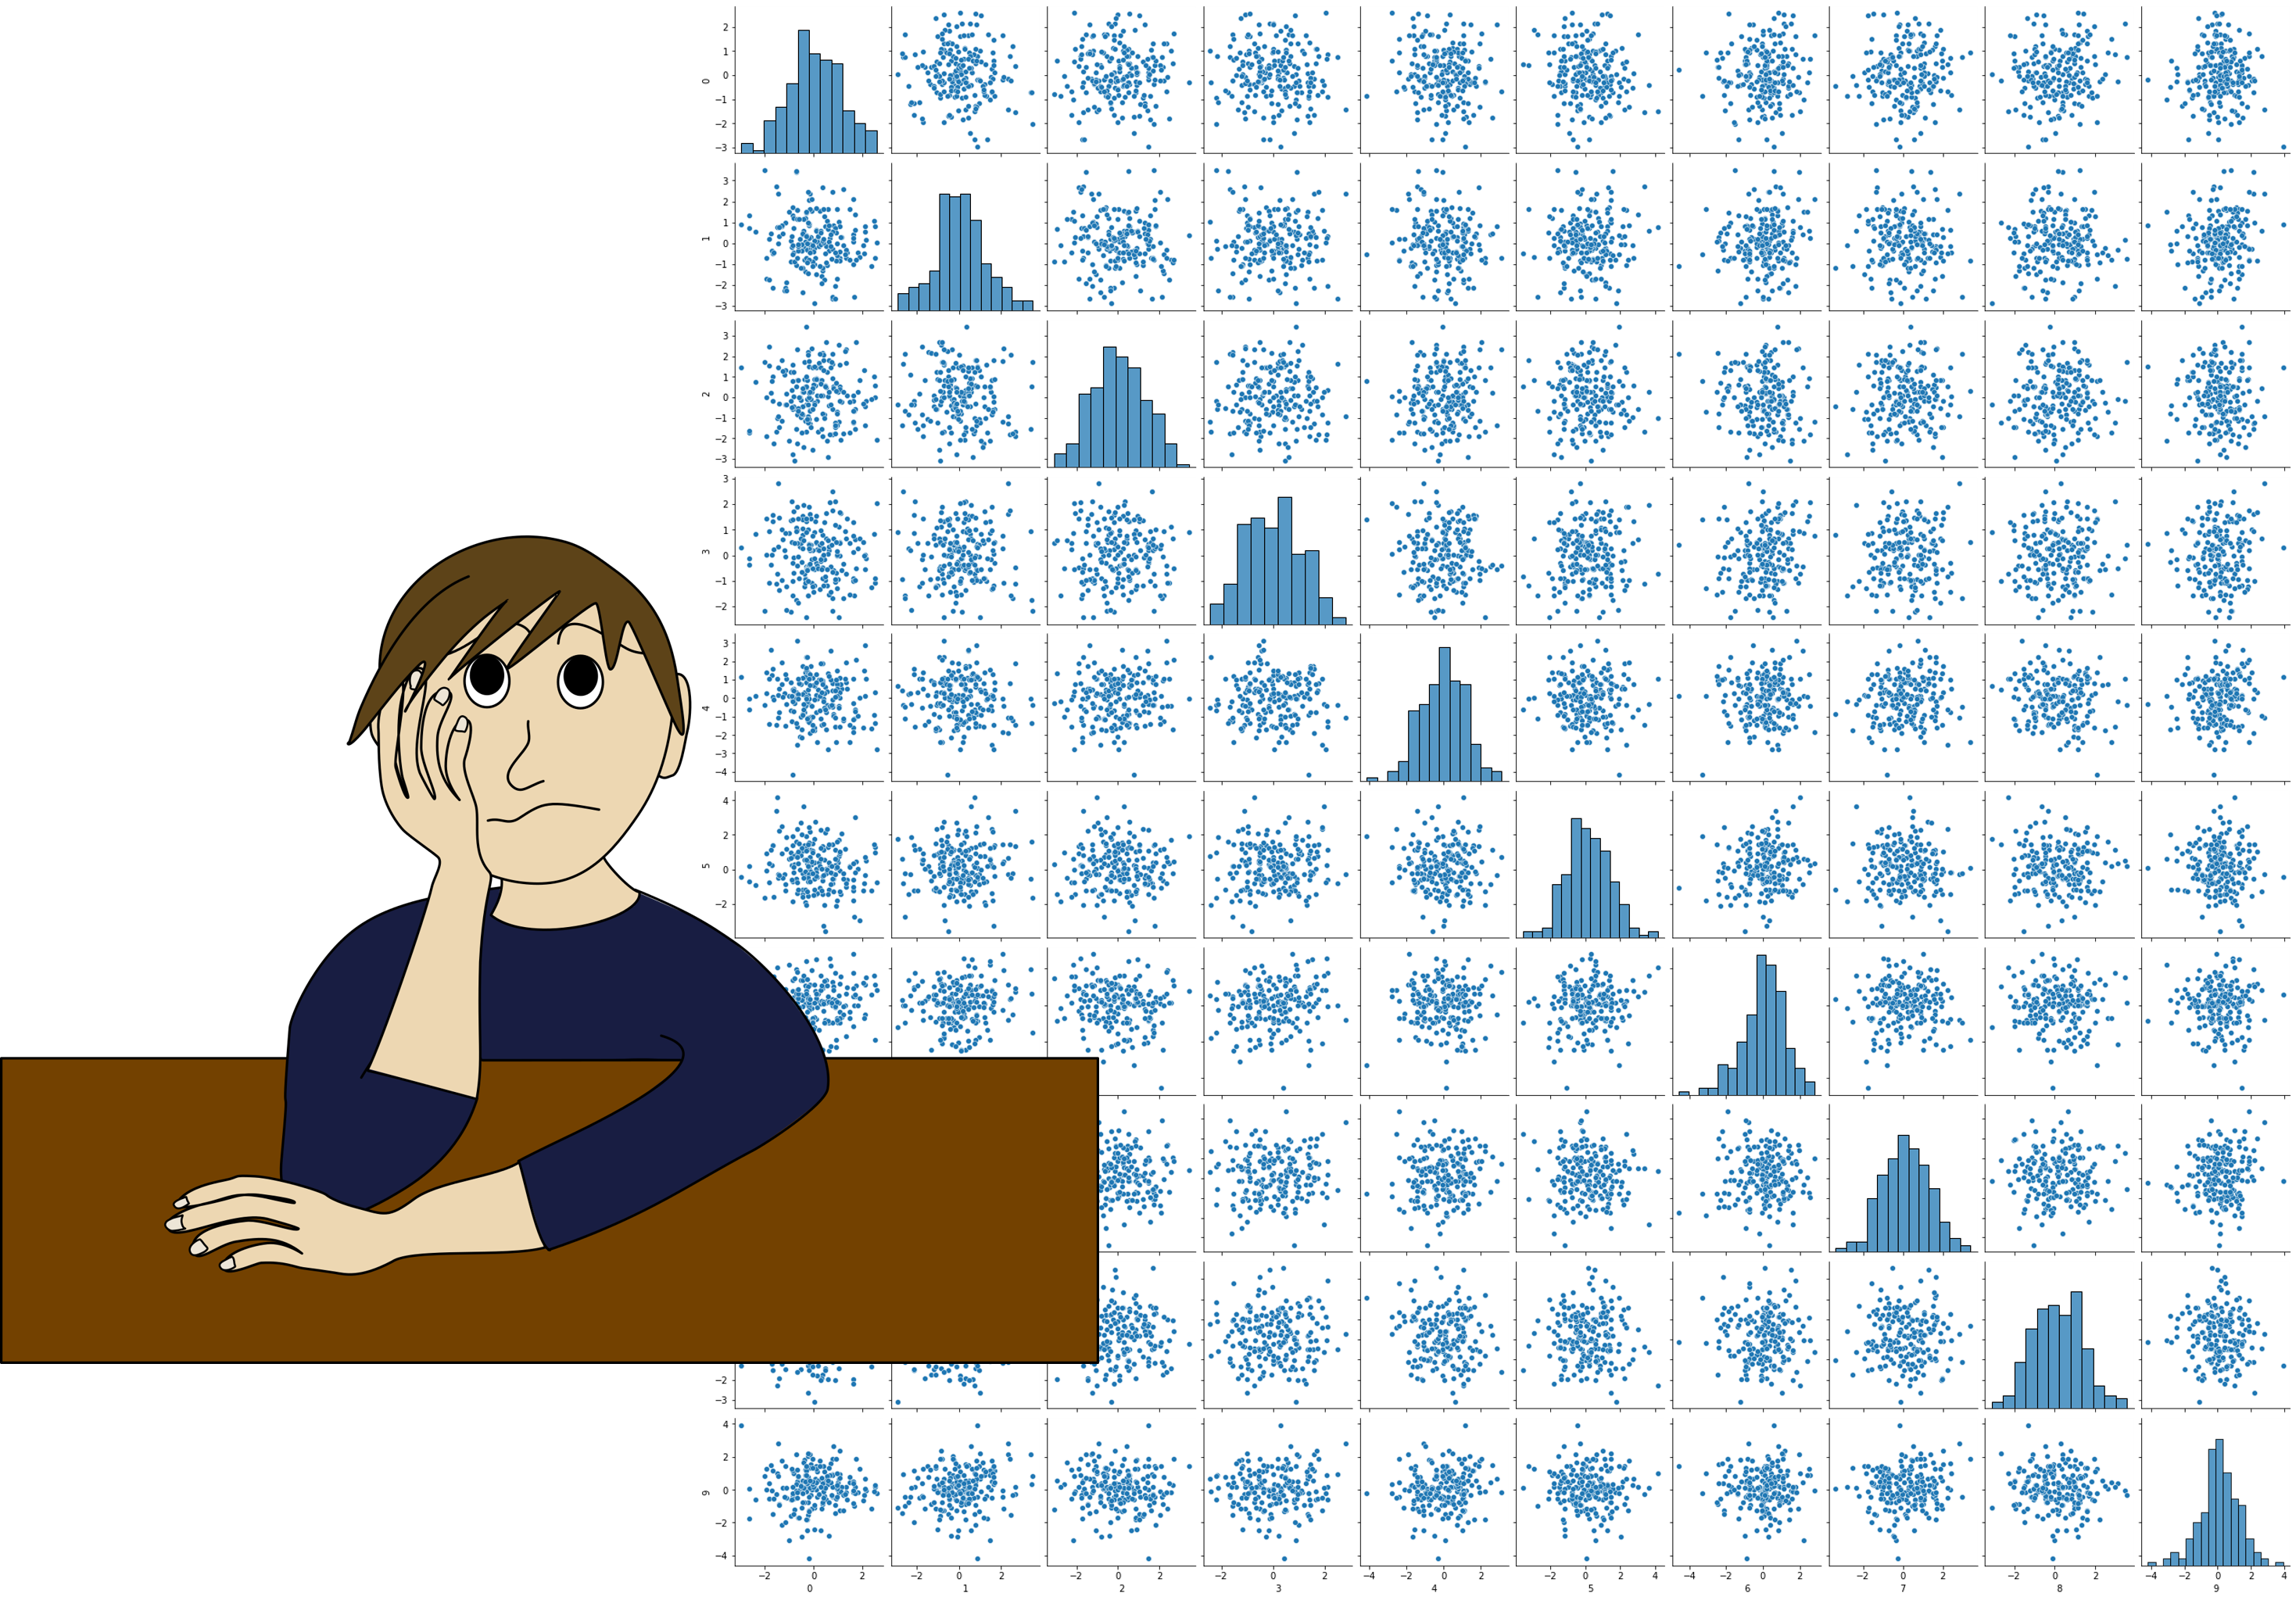 Image source: Created by the author with a Pixabay free image
Brute-force visualizations are counter-productive in this case.
And, imagine, what would happen when 10 more machines roll into your factory? Or 10 more sensors are added.
At this point, you are starting to realize that more data is actually not helping. It is not a clean-cut ML problem where you have a labeled dataset of "machine drifts". Here, you have to carefully construct statistical tests and measures to detect drift and rank machines based on that measurement.
Again, like any other data-driven problem-solving case, you have options.
- you can extract descriptive statistics from each sensor data column and pairwise compare them to those from the other machines
- you can calculate some sort of global 'distance score' for each machine from the golden machine (here is a list of distance metrics that you can evaluate using the Scipy package)
- you can compute sophisticated distance metrics between individual data distributions (e.g., Mahalanobis distance) and rank based on them
To justify the naming of this article as a hands-on tutorial, let me show you a very simple method to extract pairwise correlation scores (i.e. matching sensor 'A' data of the golden machine to the sensor 'A' data of _M_1, _M_2, _M_3, and so on, then matching sensor 'B' data of the golden machine to the sensor 'B' data of _M_1, _M_2, _M_3, and so on).
A simple demo
The boilerplate code can be found here in my Github repo.
There is one golden DataFrame machine_golden and a dictionary of 10 more DataFrames representing 10 machines, called machines. Each DataFrame has 200 (sample) rows and 10 columns (sensor measurements).
We construct these DataFrames with synthetic data representing the datasets collected from various machines. Basically, we add variable Gaussian noise to the golden dataset and generate datasets for various machines. Some machines will drift apart from the golden data more than the others due to the variable nature of the noise (Gaussian mean and variance differs by machine).
Here is the sample code to do this,
text
machines = {'machine'+str(i):[] for i in range(1,11)}
text
for i in range(1,11):
    loc = np.random.uniform(0,2)
    scale = np.random.uniform(0,2)
    df1 = machine_golden + pd.DataFrame(np.random.normal(loc=loc,scale=scale,size=(200,10)))
    machines['machine'+str(i)] = df1
Now, off to the correlation analysis.
We can write manual code by slicing each column of data and using a correlation routine from Numpy to calculate the correlation scores. However, there is a much better and cleaner method available with Pandas. It's a method called **[DataFrame.corrwith](https://pandas.pydata.org/docs/reference/api/pandas.DataFrame.corrwith.html)**that calculatesPearson correlation scores pairwise between columns of two DataFrames with just one line of code.
This is my tip for efficient data analytics. Look for compact and cleaner code alternatives. Often, they are perfectly suitable for your problem, and they yield a codebase that is clean and easy to debug. That leads to Productive Data Science.
Why and how should you learn "Productive Data Science"?
The one-line code, that also prints out the mutual correlation, is,
text
for machine in machines:
    print(f"Correlation of {machine} with the golden tester:", round(machine_golden.corrwith(machines[machine],axis=1).sum(),2))
Here we are doing column-wise correlation (axis=1) and then summing the scores (.sum()) along the row (we could have taken the mean too but since the number of samples is the same, that wouldn't matter).
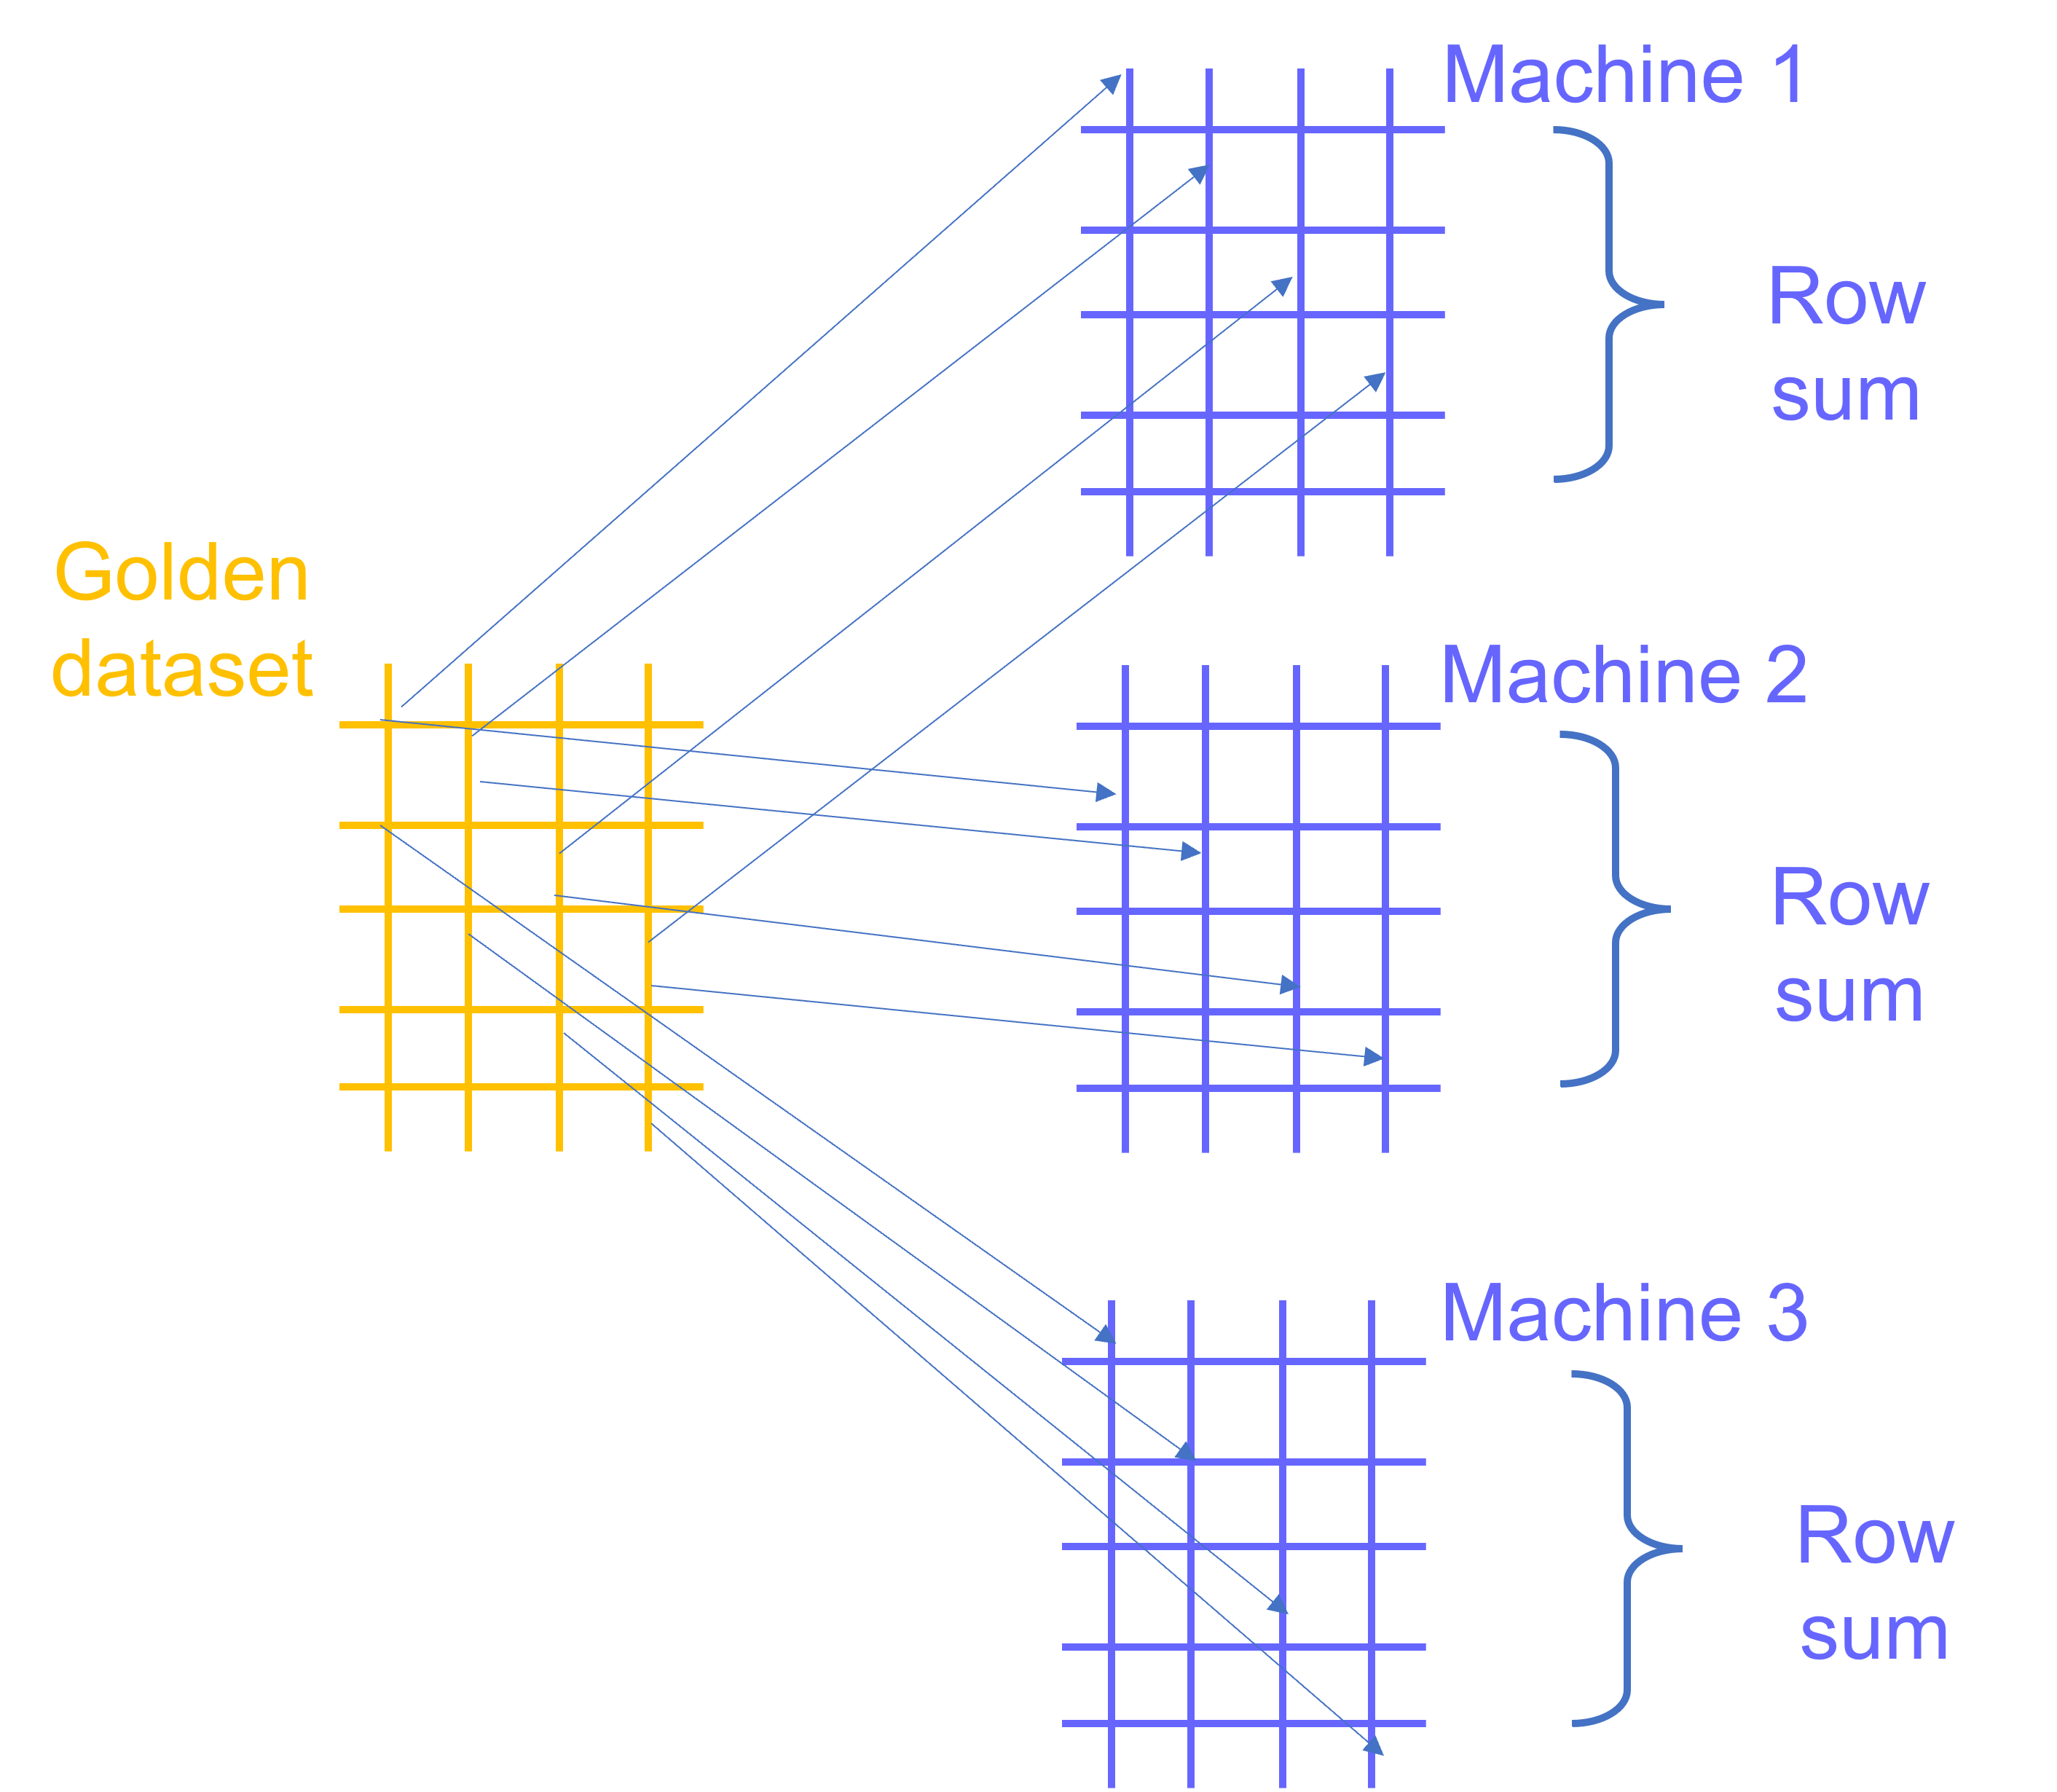 Image source: Created by the author
The result is something like,
text
Correlation of machine1 with the golden tester: 130.67
Correlation of machine2 with the golden tester: 91.78
Correlation of machine3 with the golden tester: 116.57
Correlation of machine4 with the golden tester: 178.85
Correlation of machine5 with the golden tester: 147.76
Correlation of machine6 with the golden tester: 150.91
Correlation of machine7 with the golden tester: 199.94
Correlation of machine8 with the golden tester: 192.48
Correlation of machine9 with the golden tester: 199.73
Correlation of machine10 with the golden tester: 97.73
Clearly, machine2 was least correlated with the golden machine, and machines 7, 8, and 9 are the most correlated.
Visual proof? If we plot some of the sensors' data between the golden machines and machine2/machine7.
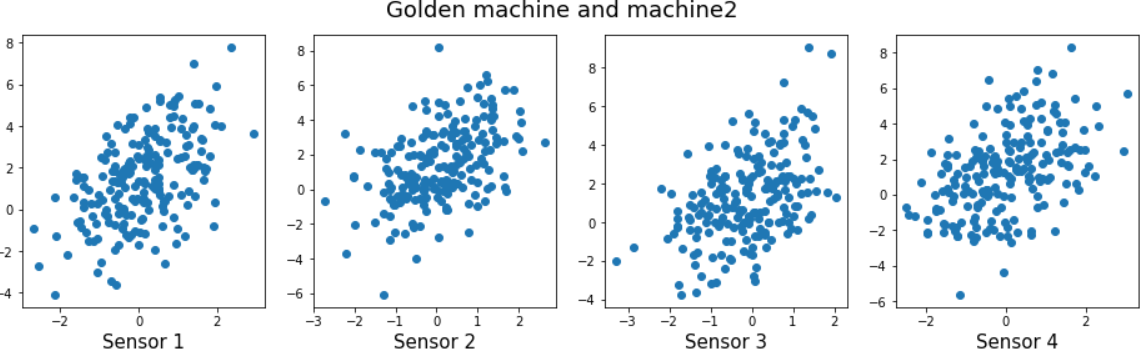 Image source: Created by the author
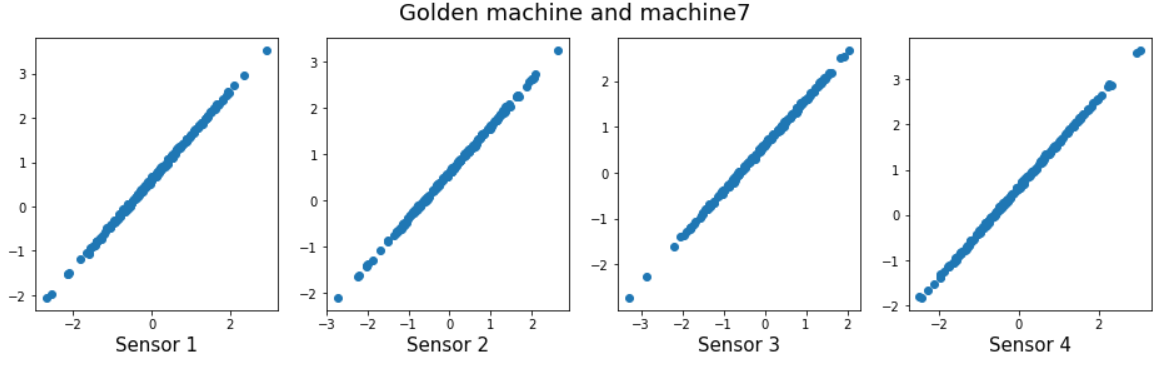 Image source: Created by the author
But we already knew that from the correlation analyses before and can pick out machines like
machine2 and machine10 that show correlation scores below 100 (just an arbitrary threshold) for intervention.
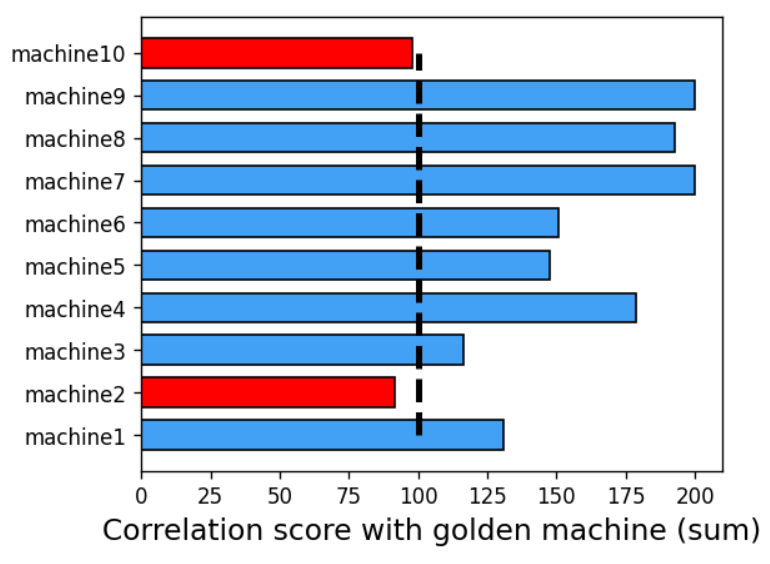 Image source: Created by the author
The best part is that this extraction of drifting machines scales smoothly with sample frequency, number of sensors, or number of machines. There is no cognitive load associated with looking at every plot and deciding what to intervene.
Next week, the drift pattern may change and another machine may start drifting more than the others. We will catch it nonetheless using the same analytics approach. Moreover, we can tweak this approach to use mean correlation so that it can handle the situation where the number of samples is different for different machines (a fairly common scenario in production).
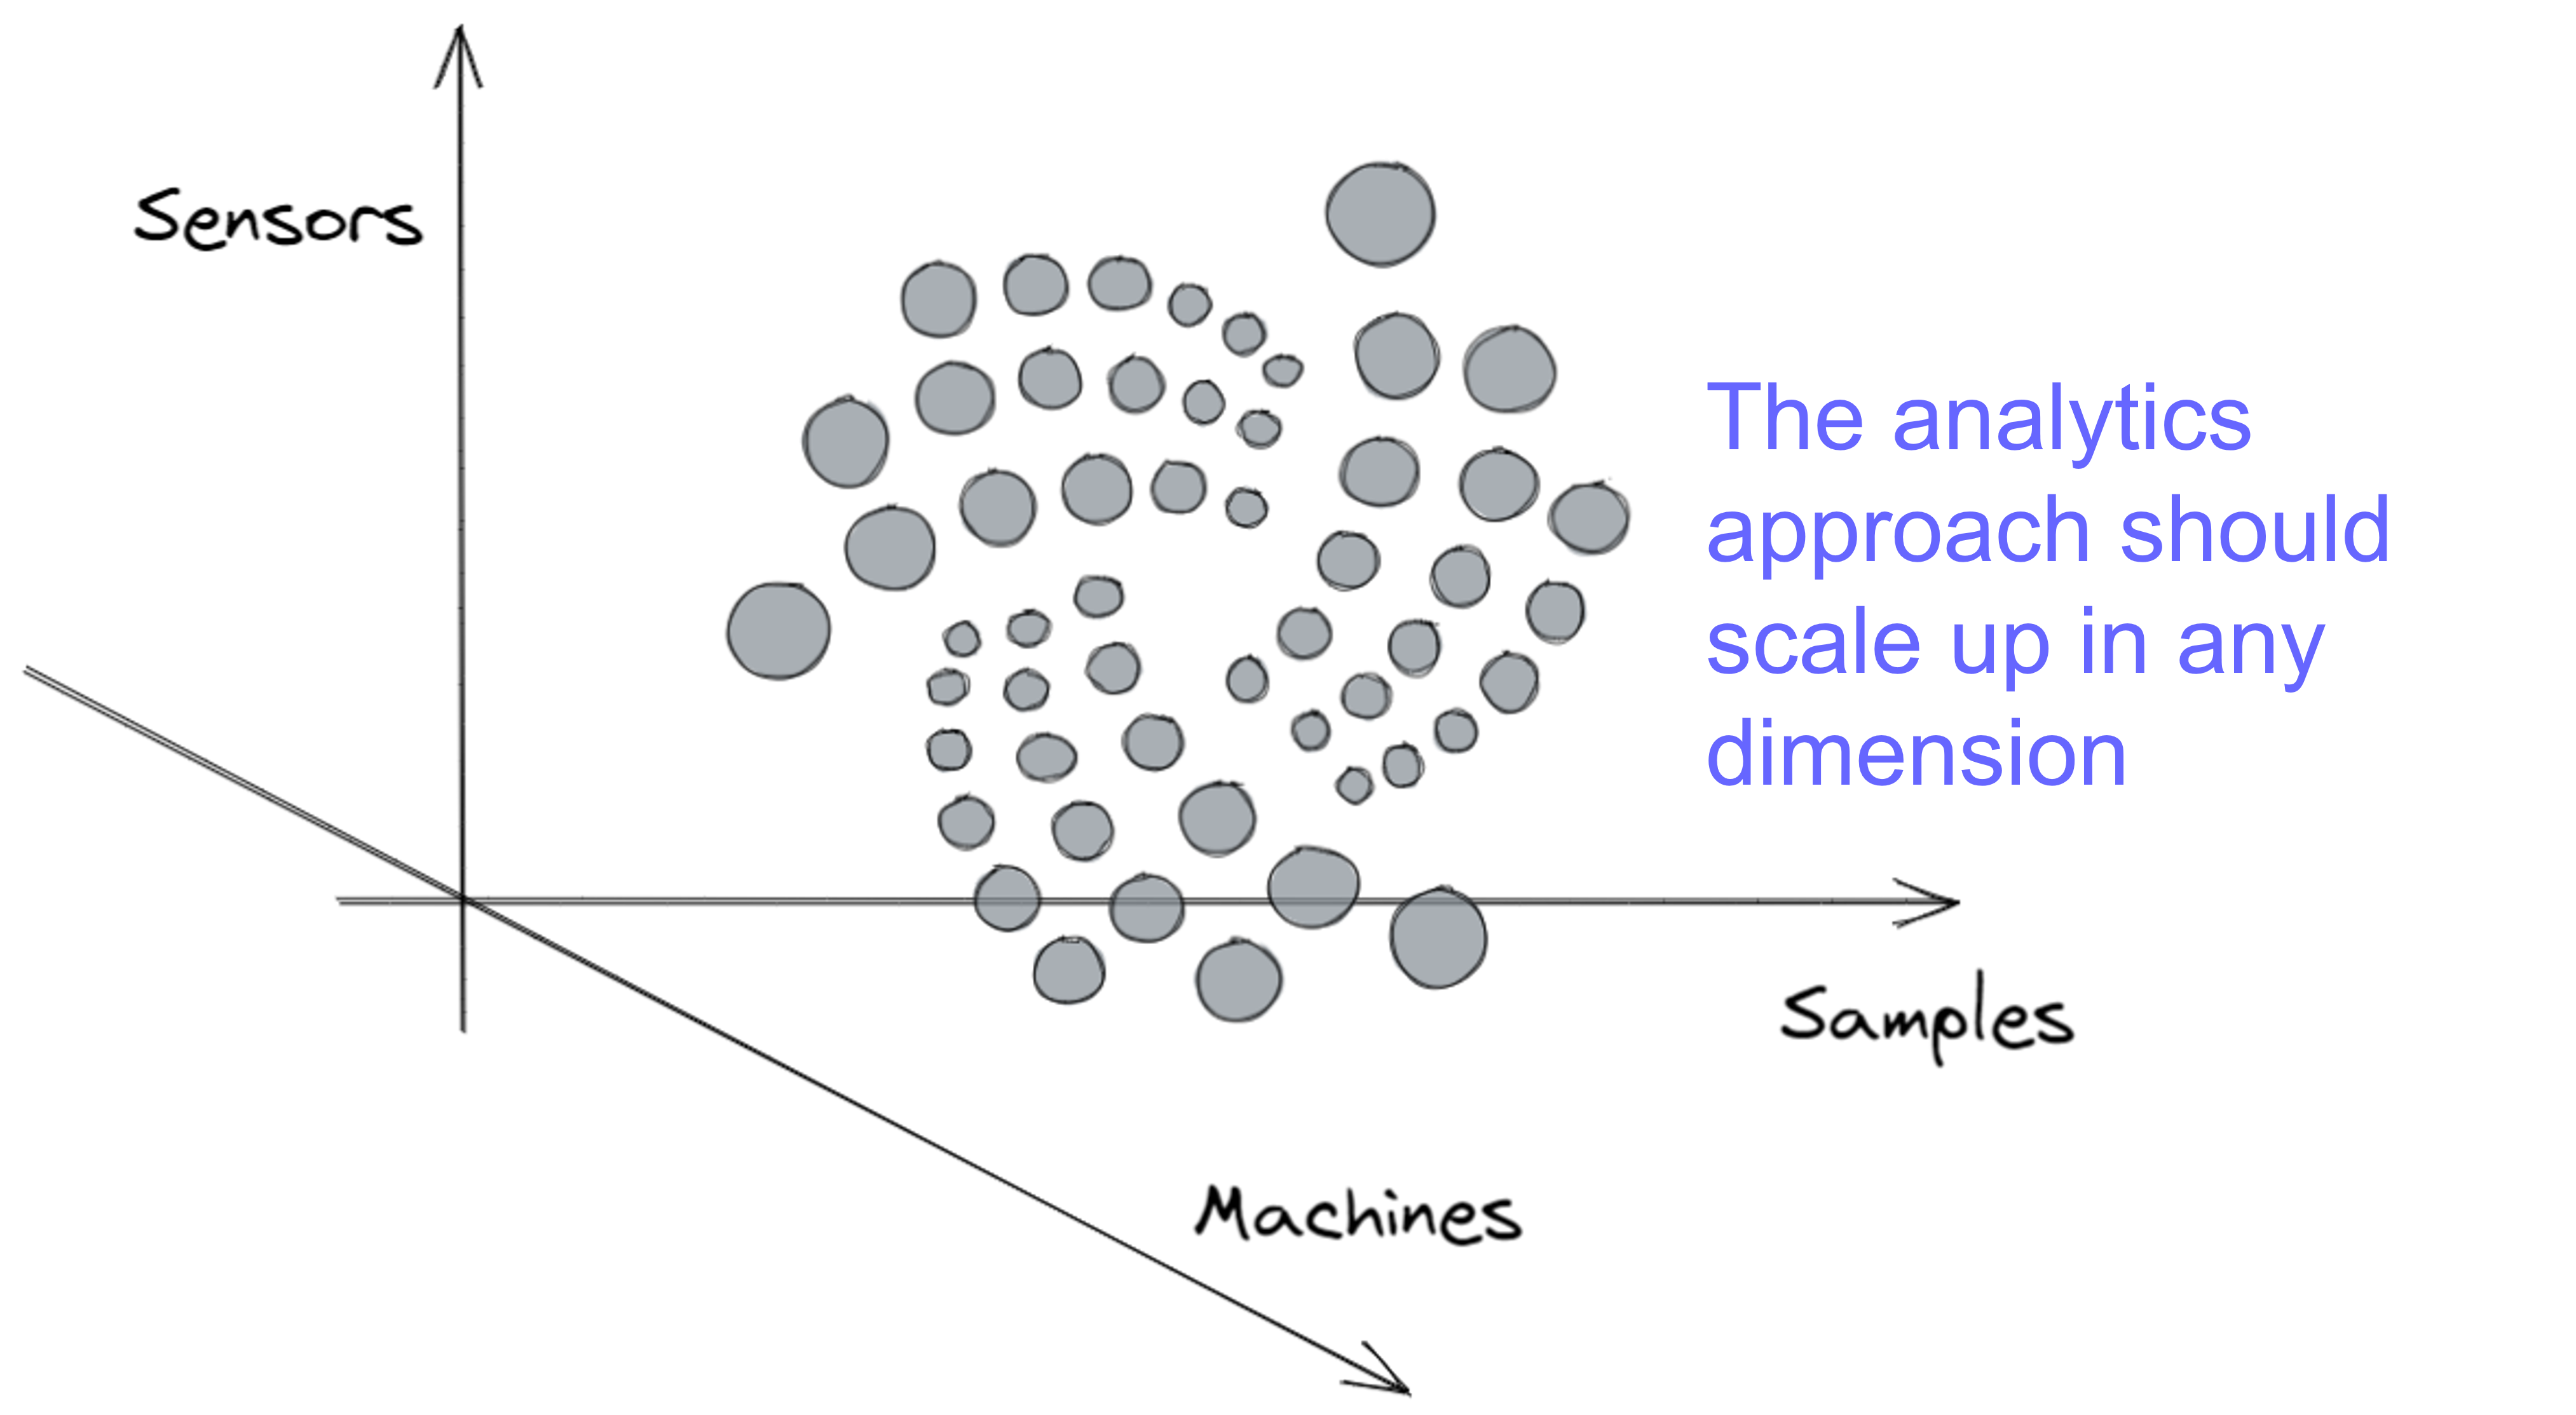 Image source: Created by the author
Summary
In this article, we show how we can handle a typical manufacturing data analytics problem of machine/tester drift and benchmark using very simple Python analytics tools.
The idea is to just show the possibilities so that engineers, working in the manufacturing sector or on Industry 4.0 initiatives, can think beyond the box and embrace data science tools and techniques in their analytics work.
Loved the article? Become a Medium member to continue learning without limits . I'll receive a portion of your membership fee if you use the following link,__with no extra cost to you .
Join Medium with my referral link - Tirthajyoti Sarkar
Register Now to Continue Reading
Unlock Towards Data Science with a Free Account
All articles on Towards Data Science are available to registered users. Create a free account today to access this article and thousands more.
Register for freeSign in to your account
 Written By
See all from Tirthajyoti Sarkar
Editor's PicksData ScienceMachine LearningManufacturingNotes From Industry
Share This Article
Towards Data Science is a community publication. Submit your insights to reach our global audience and earn through the TDS Author Payment Program.
Write for TDS
Related Articles
Machine Learning
You can now store information across app interactions and reruns
abhi saini
July 1, 20213 min read
Programming
Stop guessing and start diagnosing performance issues using Py-Spy
Kenneth McCarthy
February 5, 20269 min read
Data Science
Stop assuming you know everything
Rose Day
January 28, 20226 min read
Data Science
A few tips constructed on reflections and observations to help you steer your Data Science / Data Analytics career early on in the right...
Deepak Chopra | Talking Data Science
February 23, 20228 min read
Data Science
Break into data science without losing your money and marbles
Jack Gilmore
January 25, 20226 min read
Artificial Intelligence
Improving machine learning models' performance with hyperparameter optimization.
Farzad Nobar
June 5, 202311 min read
Machine Learning
Decoding the crusades of the statistics world - Bayesian vs Frequentism
Prashant Mudgal
January 22, 20218 min read
Artificial Intelligence
How I used CLIP, SWAGAN, and a custom genetic algorithm to create modern paintings from text descriptions
Robert A. Gonsalves
July 5, 202114 min read
Deep Learning
Implementation of Federated Learning with NON-Independent and Identically Distributed (non-IID) dataset.
Harsh Yadav
August 11, 20205 min read
Your home for data science and AI. The world's leading publication for data science, data analytics, data engineering, machine learning, and artificial intelligence professionals.
Subscribe to Our NewsletterWrite For TDS•About•Advertise•Privacy Policy•Terms of Use
© Insight Media Group, LLC 2026•The New Stack•roadmap.sh•Creator Network
Recommended Articles
Close