保留正文与补采附件。源页面当前未重新核验;具体限制见交付清单。
 We value your privacy
We use cookies to enhance your browsing experience, serve personalised ads or content, and analyse our traffic. By clicking "Accept All", you consent to our use of cookies.
Customise Reject All Accept All
Customise Consent Preferences
 We use cookies to help you navigate efficiently and perform certain functions. You will find detailed information about all cookies under each consent category below.
The cookies that are categorised as "Necessary" are stored on your browser as they are essential for enabling the basic functionalities of the site. ... Show more
NecessaryAlways Active
Necessary cookies are required to enable the basic features of this site, such as providing secure log-in or adjusting your consent preferences. These cookies do not store any personally identifiable data.
-
Cookie
BCTempID
-
Duration
10 minutes
-
Description
No description available.
-
Cookie
__cf_bm
-
Duration
1 hour
-
Description
This cookie, set by Cloudflare, is used to support Cloudflare Bot Management.
-
Cookie
AWSALBCORS
-
Duration
7 days
-
Description
Amazon Web Services set this cookie for load balancing.
-
Cookie
_cfuvid
-
Duration
session
-
Description
Cloudflare sets this cookie to track users across sessions to optimize user experience by maintaining session consistency and providing personalized services
-
Cookie
li_gc
-
Duration
6 months
-
Description
Linkedin set this cookie for storing visitor's consent regarding using cookies for non-essential purposes.
-
Cookie
__hssrc
-
Duration
session
-
Description
This cookie is set by Hubspot whenever it changes the session cookie. The __hssrc cookie set to 1 indicates that the user has restarted the browser, and if the cookie does not exist, it is assumed to be a new session.
-
Cookie
__hssc
-
Duration
1 hour
-
Description
HubSpot sets this cookie to keep track of sessions and to determine if HubSpot should increment the session number and timestamps in the __hstc cookie.
-
Cookie
wpEmojiSettingsSupports
-
Duration
session
-
Description
WordPress sets this cookie when a user interacts with emojis on a WordPress site. It helps determine if the user's browser can display emojis properly.
-
Cookie
BCSessionID
-
Duration
1 year 1 month 4 days
-
Description
Blueconic sets this cookie as a unique identifier for the BlueConic profile.
-
Cookie
_octo
-
Duration
1 year
-
Description
No description available.
-
Cookie
logged_in
-
Duration
1 year
-
Description
No description available.
-
Cookie
__Secure-YEC
-
Duration
past
-
Description
YouTube sets this cookie to stores the user's video player preferences using embedded YouTube video
-
Cookie
__eoi
-
Duration
6 months
-
Description
Description is currently not available.
-
Cookie
AWSALBTGCORS
-
Duration
7 days
-
Description
No description available.
-
Cookie
login-status-p
-
Duration
past
-
Description
Description is currently not available.
-
Cookie
AWSALBTG
-
Duration
7 days
-
Description
No description available.
-
Cookie
csrf_token
-
Duration
session
-
Description
No description available.
-
Cookie
token_v2
-
Duration
1 day
-
Description
Description is currently not available.
-
Cookie
D
-
Duration
1 year
-
Description
Description is currently not available.
-
Cookie
PHPSESSID
-
Duration
session
-
Description
This cookie is native to PHP applications. The cookie stores and identifies a user's unique session ID to manage user sessions on the website. The cookie is a session cookie and will be deleted when all the browser windows are closed.
-
Cookie
VISITOR_PRIVACY_METADATA
-
Duration
6 months
-
Description
YouTube sets this cookie to store the user's cookie consent state for the current domain.
-
Cookie
cookietest
-
Duration
session
-
Description
The cookietest cookie is typically used to determine whether the user's browser accepts cookies, essential for website functionality and user experience.
-
Cookie
__Host-airtable-session
-
Duration
1 year
-
Description
This cookie is used to enable us to integrate the services of Airtable.
-
Cookie
__Host-airtable-session.sig
-
Duration
1 year
-
Description
This cookie is used to enable us to integrate the services of Airtable.
-
Cookie
m
-
Duration
1 year 1 month 4 days
-
Description
Stripe sets this cookie for fraud prevention purposes. It identifies the device used to access the website, allowing the website to be formatted accordingly.
-
Cookie
BIGipServer*
-
Duration
session
-
Description
Marketo sets this cookie to collect information about the user's online activity and build a profile about their interests to provide advertisements relevant to the user.
-
Cookie
__cfruid
-
Duration
session
-
Description
Cloudflare sets this cookie to identify trusted web traffic.
-
Cookie
_GRECAPTCHA
-
Duration
6 months
-
Description
Google Recaptcha service sets this cookie to identify bots to protect the website against malicious spam attacks.
-
Cookie
__Secure-YNID
-
Duration
6 months
-
Description
Google cookie used to protect user security and prevent fraud, especially during the login process.
-
Cookie
cookieyes-consent
-
Duration
1 year
-
Description
CookieYes sets this cookie to remember users' consent preferences so that their preferences are respected on subsequent visits to this site. It does not collect or store any personal information about the site visitors.
Functional
Functional cookies help perform certain functionalities like sharing the content of the website on social media platforms, collecting feedback, and other third-party features.
-
Cookie
lidc
-
Duration
1 day
-
Description
LinkedIn sets the lidc cookie to facilitate data center selection.
-
Cookie
brw
-
Duration
1 year
-
Description
No description available.
-
Cookie
brwConsent
-
Duration
5 minutes
-
Description
Description is currently not available.
-
Cookie
WMF-Uniq
-
Duration
1 year
-
Description
Description is currently not available.
-
Cookie
loom_anon_comment
-
Duration
1 year
-
Description
No description available.
-
Cookie
loom_referral_video
-
Duration
session
-
Description
Description is currently not available.
-
Cookie
VISITOR_INFO1_LIVE
-
Duration
6 months
-
Description
A cookie set by YouTube to measure bandwidth that determines whether the user gets the new or old player interface.
-
Cookie
yt-remote-connected-devices
-
Duration
Never Expires
-
Description
YouTube sets this cookie to store the user's video preferences using embedded YouTube videos.
-
Cookie
ytidb::LAST_RESULT_ENTRY_KEY
-
Duration
Never Expires
-
Description
The cookie ytidb::LAST_RESULT_ENTRY_KEY is used by YouTube to store the last search result entry that was clicked by the user. This information is used to improve the user experience by providing more relevant search results in the future.
-
Cookie
yt-remote-device-id
-
Duration
Never Expires
-
Description
YouTube sets this cookie to store the user's video preferences using embedded YouTube videos.
-
Cookie
yt-remote-session-name
-
Duration
session
-
Description
The yt-remote-session-name cookie is used by YouTube to store the user's video player preferences using embedded YouTube video.
-
Cookie
yt-remote-fast-check-period
-
Duration
session
-
Description
The yt-remote-fast-check-period cookie is used by YouTube to store the user's video player preferences for embedded YouTube videos.
-
Cookie
yt-remote-session-app
-
Duration
session
-
Description
The yt-remote-session-app cookie is used by YouTube to store user preferences and information about the interface of the embedded YouTube video player.
-
Cookie
yt-remote-cast-available
-
Duration
session
-
Description
The yt-remote-cast-available cookie is used to store the user's preferences regarding whether casting is available on their YouTube video player.
-
Cookie
yt-remote-cast-installed
-
Duration
session
-
Description
The yt-remote-cast-installed cookie is used to store the user's video player preferences using embedded YouTube video.
-
Cookie
cp_session
-
Duration
3 months
-
Description
Codepen sets this cookie for Help systems found in the website.
-
Cookie
loid
-
Duration
1 year 1 month 4 days
-
Description
This cookie is set by the Reddit. The cookie enables the sharing of content from the website onto the social media platform.
Analytics
Analytical cookies are used to understand how visitors interact with the website. These cookies help provide information on metrics such as the number of visitors, bounce rate, traffic source, etc.
-
Cookie
__hstc
-
Duration
6 months
-
Description
Hubspot set this main cookie for tracking visitors. It contains the domain, initial timestamp (first visit), last timestamp (last visit), current timestamp (this visit), and session number (increments for each subsequent session).
-
Cookie
hubspotutk
-
Duration
6 months
-
Description
HubSpot sets this cookie to keep track of the visitors to the website. This cookie is passed to HubSpot on form submission and used when deduplicating contacts.
-
Cookie
_ga
-
Duration
1 year 1 month 4 days
-
Description
Google Analytics sets this cookie to calculate visitor, session and campaign data and track site usage for the site's analytics report. The cookie stores information anonymously and assigns a randomly generated number to recognise unique visitors.
-
Cookie
ga*
-
Duration
1 year 1 month 4 days
-
Description
Google Analytics sets this cookie to store and count page views.
-
Cookie
__Host-psifi.analyticsTrace
-
Duration
6 hours
-
Description
Description is currently not available.
-
Cookie
__Host-psifi.analyticsTraceV2
-
Duration
6 hours
-
Description
Description is currently not available.
-
Cookie
_gh_sess
-
Duration
session
-
Description
GitHub sets this cookie for temporary application and framework state between pages like what step the user is on in a multiple step form.
-
Cookie
YSC
-
Duration
session
-
Description
YSC cookie is set by Youtube and is used to track the views of embedded videos on Youtube pages.
-
Cookie
ajs_anonymous_id
-
Duration
1 year
-
Description
This cookie is set by Segment to count the number of people who visit a certain site by tracking if they have visited before.
-
Cookie
vuid
-
Duration
1 year 1 month 4 days
-
Description
Vimeo installs this cookie to collect tracking information by setting a unique ID to embed videos on the website.
Performance
Performance cookies are used to understand and analyse the key performance indexes of the website which helps in delivering a better user experience for the visitors.
-
Cookie
AWSALB
-
Duration
7 days
-
Description
AWSALB is an application load balancer cookie set by Amazon Web Services to map the session to the target.
-
Cookie
acq
-
Duration
past
-
Description
Description is currently not available.
-
Cookie
acq.sig
-
Duration
past
-
Description
Description is currently not available.
-
Cookie
ptc
-
Duration
2 years
-
Description
No description available.
Advertisement
Advertisement cookies are used to provide visitors with customised advertisements based on the pages you visited previously and to analyse the effectiveness of the ad campaigns.
-
Cookie
muc_ads
-
Duration
1 year 1 month 4 days
-
Description
Twitter sets this cookie to collect user behaviour and interaction data to optimize the website.
-
Cookie
guest_id_marketing
-
Duration
1 year 1 month 4 days
-
Description
Twitter sets this cookie to identify and track the website visitor.
-
Cookie
guest_id_ads
-
Duration
1 year 1 month 4 days
-
Description
Twitter sets this cookie to identify and track the website visitor.
-
Cookie
personalization_id
-
Duration
1 year 1 month 4 days
-
Description
Twitter sets this cookie to integrate and share features for social media and also store information about how the user uses the website, for tracking and targeting.
-
Cookie
guest_id
-
Duration
1 year 1 month 4 days
-
Description
Twitter sets this cookie to identify and track the website visitor. It registers if a user is signed in to the Twitter platform and collects information about ad preferences.
-
Cookie
bcookie
-
Duration
1 year
-
Description
LinkedIn sets this cookie from LinkedIn share buttons and ad tags to recognize browser IDs.
-
Cookie
__Secure-ROLLOUT_TOKEN
-
Duration
6 months
-
Description
YouTube sets this cookie to manage feature rollout and experimentation. It helps Google control which new features or interface changes are shown to users as part of testing and staged rollouts, ensuring consistent experience for a given user during an experiment.
-
Cookie
yt.innertube::nextId
-
Duration
Never Expires
-
Description
YouTube sets this cookie to register a unique ID to store data on what videos from YouTube the user has seen.
-
Cookie
yt.innertube::requests
-
Duration
Never Expires
-
Description
YouTube sets this cookie to register a unique ID to store data on what videos from YouTube the user has seen.
-
Cookie
session_tracker
-
Duration
session
-
Description
This cookie is set by the Reddit. This cookie is used to identify trusted web traffic. It also helps in adverstising on the website.
-
Cookie
edgebucket
-
Duration
session
-
Description
Reddit sets this cookie to save the information about a log-on Reddit user, for the purpose of advertisement recommendations and updating the content.
-
Cookie
did
-
Duration
1 year
-
Description
Arbor sets this cookie to show targeted ads to site visitors.This cookie expires after 2 months or 1 year.
Uncategorised
Other uncategorised cookies are those that are being analysed and have not been classified into a category as yet.
No cookies to display.
Reject All Save My Preferences Accept All
Toggle SearchToggle Mobile Navigation
Publish AI, ML & data-science insights to a global community of data professionals.
Sign inSubmit an Article
LatestEditor's PicksNewsletterShipAI
Write For TDS
LinkedInXToggle Search
Data Science
Bootstrap Resampling
No, not Twitter Bootstrap - this bootstrapping is a way of sampling data, and it is one of the most important to consider what underlies...
James Andrew Godwin
February 2, 20218 min read
Simple, straightforward, convenient.
 Alternate Data Dimension | Photo by Rene Böhmer
No, not Twitter Bootstrap - this bootstrapping is a way of sampling data, and it is one of the most important to consider what underlies the variation of numbers, the variation of distributions, what underlies distributions. To that end, bootstrapping works really, really well. For Data Scientists, Machine Learning Engineers, and statisticians alike it is vital to understand resampling methods.
But why use resampling? We use resampling because we only have a limited amount of data - the limits of time, and economics, to say the least. What then is resampling? Resampling is when you take a sample, and then you take a sample of the sample. Why would you do that? Well, it allows you to see how much variation there would have been, it allows you to get a different understanding of the sample that you took. Say, for example, you wanted 1000 people to answer a survey, but you only have 100. By cleverly subsampling the samples we can get a new distribution, which we will know a little bit about the uncertainty of the sample; which we further presume is related to the uncertainty of the underlying population.
We can compute statistics from multiple sub samples of data sets, such as the mean. We take a bunch of these items, we sum them up and divide them by the count by the number of items. The trick to bootstrap resampling is sampling with replacement.
In Python, typically there will be a Boolean argument to your sampling parameter in your sampling code to your sampling function. This Boolean flag will be replace = true or replace = false. If you have 100 items, randomly sample (e.g., Bernoulli sample) the sample - record it, and replace that value back into the sample pool. Then rinse and repeat 99 more times. This subsample population is very likely to be different. They will have different proportions of the original 100 values. For the most part, the values are going to be pretty evenly distributed, but not perfectly. Then repeat this process a total of 10 times to generate 1000 samples. Note that occasionally some weird things can occur - e.g., if your data has one unique value of X - it is possible, but not likely due to sampling with replacement, that you can randomly subsample 100 values that include 5 X values, despite the sampled population only having one.
For each of these samples, we can calculate the mean. And then we can look at the distribution of these means. Or we can look at the average of these means. The average of these means again should be pretty close to the population average, and should be pretty close to that larger sample average. You can do the same thing for other metrics, like standard deviations. Bootstrapping is a very powerful technique that allows you to get to another way of getting the uncertainties of your measurements. Because when you take those, when you get the means this variation of the means of all the sub samples will tell us quite a bit about the uncertainty that we would have that your sample has in respect to the true underlying population.
Bootstrap Benefits
Bootstrap and resampling are widely applicable statistical methods which relax many of the assumptions of classical statistics. Resampling methods implicitly draw on the Central Limit Theorem, as explained in my previous article. Specifically bootstrap (and other resampling methods):
- Allows computation of statistics from limited data.
- Allows us to compute statistics from multiple subsamples of the dataset.
- Allows us to make minimal distribution assumptions.
Commonly used resampling methods include:
- Randomization or permutation methods (e.g., Fisher's exact test). Randomization and permutation methods were pioneered by Fisher as early as 1911. Fisher fully developed the theory in his 1935 book. Scalability of these methods remain limited, even with modern computers.
- Cross validation: resample into folds without replacement. Originally proposed by Kurtz in 1948, cross-validation today is widely used in the testing of machine learning models.
- Jackknife: leave one out resampling. Maurice Quenouille originally proposed this method in 1949. The jackknife was fully developed by John W. Tukey, who gave the method its name, in 1958: that the method was a simple tool useful for many purposes like a pocket knife.
- Bootstrap: resample with equivalent size and replacement. The bootstrap method was first suggested by Efron and Hinkley in 1978 and further developed by Efron in 1979.
Bootstrap Overview
We compute the bootstrap mean as:



Bootstrap Example
To demonstrate the power of bootstrap I will analyze the means of the heights of different populations from Galton's height dataset in a Jupyter notebook; famous for giving us the phrase "regression to the mean" w/r to children's heights. The following is an example of a parametric bootstrap estimate - parametric because our model has a parameter, the mean, we are trying to estimate.
I will demonstrate with an example:
text
import pandas as pd
import numpy as np
from matplotlib import pyplot as plt
import seaborn as sns
text
%matplotlib inline
Importing the basic libraries
text
# i imported the dataset from here, and called file_name
galton-families = pd.read_csv(file_name, index_col=0)
galton-families.head()
Check that the data is well-imported.
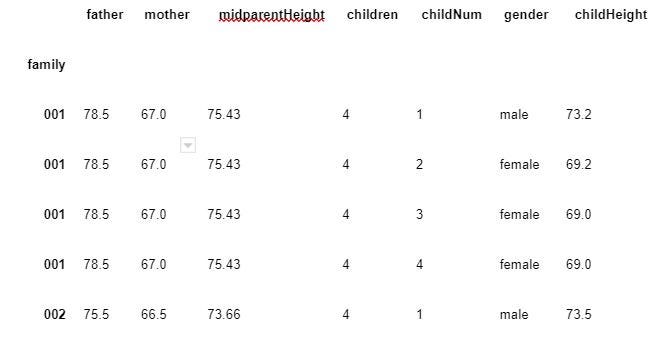 Now I will subset the dataframe by gender to get the number of men and women in the dataset. This is going to create two data sets, one called male one called female. Male is actually sons and female is actually daughters.
text
male = galton-families[galton-families.gender == 'male']
female = galton-families[galton-families.gender == 'female']
text
len(male), len(female)
(481, 453)
The set looks reasonably balanced with 481 males, 453 females in this dataset. The following code shows the min and max values in these distributions:
text
print(families.childHeight.min())
families.childHeight.max()
56.0
Out[11]: 79.0
They range from 56 inches to 79 inches. The next thing to do is to plot these two histograms:
text
def plot_hist(x, p=5):
 # Plot the distribution and mark the mean
 plt.hist(x, alpha=.5)
 plt.axvline(x.mean())
 # 95% confidence interval
 plt.axvline(np.percentile(x, p/2.), color='red', linewidth=3)
 plt.axvline(np.percentile(x, 100-p/2.), color='red', linewidth=3)

def plot_dists(a, b, nbins, a_label='pop_A', b_label='pop_B', p=5):
 # Create a single sequence of bins to be shared across both
 # distribution plots for visualization consistency.
 combined = pd.concat([a, b])
 breaks = np.linspace(
 combined.min(),
 combined.max(),
 num=nbins+1)
text
 plt.subplot(2, 1, 1)
 plot_hist(a)
 plt.title(a_label)

 plt.subplot(2, 1, 2)
 plot_hist(b)
 plt.title(b_label)

 plt.tight_layout()
text
plot_dists(male.childHeight, female.childHeight, 20, a_label='sons', b_label='daughters')
plt.show()
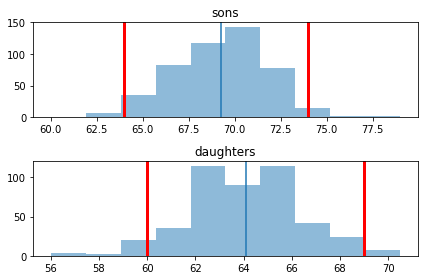 The important thing to note here is that there is a significant overlap between sons and daughters. You can see that some of the daughters are actually taller than the mean of the sons. Overall, we can see that the daughters are smaller than the sons, but is it significant?
My last post on the CLT demonstrated very clear ways of how to distinguish between these two distributions. It might look like these are two different distributions. However, we might actually say the distribution of the sons is not that different from the distributions of the daughters, because the 95% confidence level, which is indicated with these red vertical bars, sort of overlaps with the mean.
Bootstrap the Means
Bootstrap to the rescue. We are going to resample from our sample. Pandas has built-in support for generating bootstrap samples from a given dataframe. I will use the sample() method of our two dataframes to draw a single bootstrap sample like so:
text
female.sample(frac=1, replace=True).head()
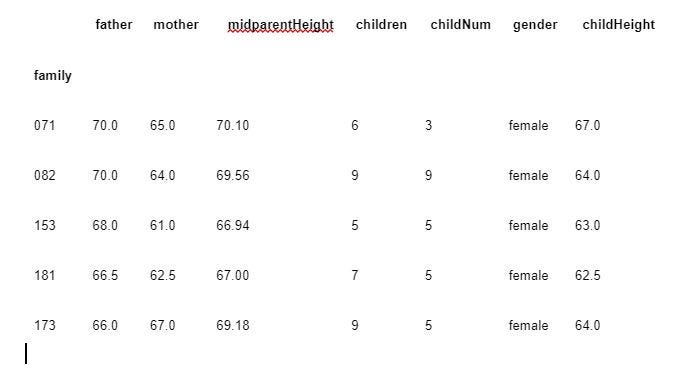 NB: With the replace equals true argument, you might get the same row multiple times, or some rows you are not going to sample at all.
The above sample of all the daughters sampled from the Galton dataset has the following mean:
text
female.sample(frac=1, replace=True).father.mean()
69.0664459161148
This bootstrapped sample of the female dataframe has a mean height of 69.1 inches for 453 daughters.
Now we will take many (_n replicas) bootstrap samples and plot the distribution of sample means, as well as the mean of the sample, means. In the following code, we bootstrap 1000 subsamples each of the original size of the dataframe (481 and 453).
text
n_replicas = 1000
text
female_bootstrap_means = pd.Series([
 female.sample(frac=1, replace=True).childHeight.mean()
 for i in range(n_replicas)])
text
male_bootstrap_means = pd.Series([
 male.sample(frac=1, replace=True).childHeight.mean()
 for i in range(n_replicas)])
text
plot_dists(male_bootstrap_means, female_bootstrap_means,
 nbins=80, a_label='sons', b_label='daughters')
plt.show()
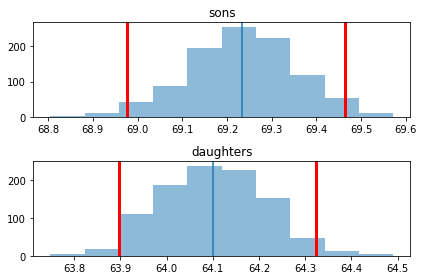 The distribution of the bootstrap means does not overlap at all! This proves that the difference is significant.
Bootstrap the Difference in Means
In the cell below, I will show how to generate bootstrap samples from the full male + female dataset and then difference in the means of male and female childHeight for each sample, generating a distribution of sample mean diffs.
text
diffs = []
for i in range(n_replicas):
 sample = families.sample(frac=1.0, replace=True)
 male_sample_mean = sample[sample.gender == 'male'].childHeight.mean()
 female_sample_mean = sample[sample.gender == 'female'].childHeight.mean()
 diffs.append(male_sample_mean - female_sample_mean)
diffs = pd.Series(diffs)
text
plot_hist(diffs)
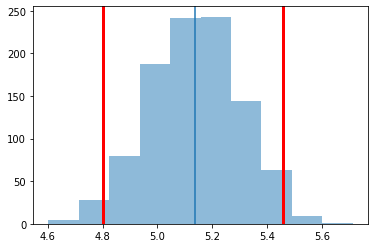 The distribution of the difference in means is far from zero. As like before, we can infer that the means of the two populations are significantly different - which for the purposes of this dataset is to say that sons and daughters do have different mean heights. Said differently: the confidence interval does not straddle zero, and because it does not straddle zero, we are confident that the difference is significant. The blue line indicates the mean difference between sons and daughters from the bootstrap sample of around 5.1 inches, of which we are 95% confident that the true population mean difference is between 4.8 inches and around 5.5 inches. This is the answer - that on average, sons are 5.5 inches taller than daughters.
However, we must verify that the distribution of the difference in means normal, as implied by the CLT. If the data is not normally distributed then we cannot trust the 95% CI:
text
import statsmodels.api as sm
fig = sm.qqplot(diffs, line='s')
plt.title('Quantiles of standard Normal vs. bookstrapped mean')
plt.show()
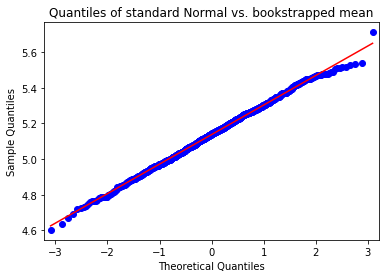 The points on the Q-Q Normal plot are nearly on a straight line. Apparently, the bootstrap distribution of the difference in means does conform to the CLT, which allows us to trust the statistics we derived from bootstrap resampling the original dataset.
Conclusion
The results of this analysis have demonstrated how useful a tool resampling is for a Data Scientist or Machine Learning Engineer. Bootstrap is not the only resampling method, there are several, but IMO it is the best for production models because it makes minimal assumptions about the parent distribution and is well implemented into many languages and packages. Data is useless if it is not properly treated and analyzed with the correct context. As Mark Twain famously said, "There are lies, damned lies, and statistics."
Continue with me as I build on these concepts in Bayes statistics and using bootstrap with regression models.
Find me on Linkedin
Physicist cum Data Scientist- Available for new opportunity | SaaS | Sports | Start-ups | Scale-ups
Register Now to Continue Reading
Unlock Towards Data Science with a Free Account
All articles on Towards Data Science are available to registered users. Create a free account today to access this article and thousands more.
Register for freeSign in to your account
 Written By
See all from James Andrew Godwin
Editor's PicksData ScienceMachine LearningResamplingStatistics
Share This Article
Towards Data Science is a community publication. Submit your insights to reach our global audience and earn through the TDS Author Payment Program.
Write for TDS
Related Articles
Data Science
Why we need stories to explain Data Science
Chris Walsh
February 15, 20235 min read
Machine Learning
Counting the frequency of a specific value in a pandas DataFrame column
Giorgos Myrianthous
February 15, 20224 min read
Data Science
A practical python toolkit to visualize facial expression data
Cole Hagen
September 20, 20212 min read
The interpretation process can be detached from the model architecture
Valeria Fonseca Diaz
April 16, 20226 min read
Data Science
"Correlation doesn't imply causation, but it does waggle its eyebrows suggestively and gesture furtively while mouthing 'look over...
Ryan Kearns
December 7, 202211 min read
Artificial Intelligence
Impressions on agentic AI progress and the AI-2027 Jobocalypse scenario
Marina Tosic
July 16, 20256 min read
Machine Learning
Siri, Please watch my 1-hour long University lecture video and make a summary for me
Alex Aman
September 11, 20203 min read
Artificial Intelligence
A method to balance multiple objectives for your recommendation output
Tian Jie
March 17, 20248 min read
Machine Learning
Unsupervised Machine Learning Algorithm for Dimensionality Reduction
Rukshan Pramoditha
January 9, 20218 min read
Your home for data science and AI. The world's leading publication for data science, data analytics, data engineering, machine learning, and artificial intelligence professionals.
Subscribe to Our NewsletterWrite For TDS•About•Advertise•Privacy Policy•Terms of Use
© Insight Media Group, LLC 2026•The New Stack•roadmap.sh•Creator Network
Recommended Articles
Close