保留正文与补采附件。源页面当前未重新核验;具体限制见交付清单。
 We value your privacy
We use cookies to enhance your browsing experience, serve personalised ads or content, and analyse our traffic. By clicking "Accept All", you consent to our use of cookies.
Customise Reject All Accept All
Customise Consent Preferences
 We use cookies to help you navigate efficiently and perform certain functions. You will find detailed information about all cookies under each consent category below.
The cookies that are categorised as "Necessary" are stored on your browser as they are essential for enabling the basic functionalities of the site. ... Show more
NecessaryAlways Active
Necessary cookies are required to enable the basic features of this site, such as providing secure log-in or adjusting your consent preferences. These cookies do not store any personally identifiable data.
-
Cookie
BCTempID
-
Duration
10 minutes
-
Description
No description available.
-
Cookie
__cf_bm
-
Duration
1 hour
-
Description
This cookie, set by Cloudflare, is used to support Cloudflare Bot Management.
-
Cookie
AWSALBCORS
-
Duration
7 days
-
Description
Amazon Web Services set this cookie for load balancing.
-
Cookie
_cfuvid
-
Duration
session
-
Description
Cloudflare sets this cookie to track users across sessions to optimize user experience by maintaining session consistency and providing personalized services
-
Cookie
li_gc
-
Duration
6 months
-
Description
Linkedin set this cookie for storing visitor's consent regarding using cookies for non-essential purposes.
-
Cookie
__hssrc
-
Duration
session
-
Description
This cookie is set by Hubspot whenever it changes the session cookie. The __hssrc cookie set to 1 indicates that the user has restarted the browser, and if the cookie does not exist, it is assumed to be a new session.
-
Cookie
__hssc
-
Duration
1 hour
-
Description
HubSpot sets this cookie to keep track of sessions and to determine if HubSpot should increment the session number and timestamps in the __hstc cookie.
-
Cookie
wpEmojiSettingsSupports
-
Duration
session
-
Description
WordPress sets this cookie when a user interacts with emojis on a WordPress site. It helps determine if the user's browser can display emojis properly.
-
Cookie
BCSessionID
-
Duration
1 year 1 month 4 days
-
Description
Blueconic sets this cookie as a unique identifier for the BlueConic profile.
-
Cookie
_octo
-
Duration
1 year
-
Description
No description available.
-
Cookie
logged_in
-
Duration
1 year
-
Description
No description available.
-
Cookie
__Secure-YEC
-
Duration
past
-
Description
YouTube sets this cookie to stores the user's video player preferences using embedded YouTube video
-
Cookie
__eoi
-
Duration
6 months
-
Description
Description is currently not available.
-
Cookie
AWSALBTGCORS
-
Duration
7 days
-
Description
No description available.
-
Cookie
login-status-p
-
Duration
past
-
Description
Description is currently not available.
-
Cookie
AWSALBTG
-
Duration
7 days
-
Description
No description available.
-
Cookie
csrf_token
-
Duration
session
-
Description
No description available.
-
Cookie
token_v2
-
Duration
1 day
-
Description
Description is currently not available.
-
Cookie
D
-
Duration
1 year
-
Description
Description is currently not available.
-
Cookie
PHPSESSID
-
Duration
session
-
Description
This cookie is native to PHP applications. The cookie stores and identifies a user's unique session ID to manage user sessions on the website. The cookie is a session cookie and will be deleted when all the browser windows are closed.
-
Cookie
VISITOR_PRIVACY_METADATA
-
Duration
6 months
-
Description
YouTube sets this cookie to store the user's cookie consent state for the current domain.
-
Cookie
cookietest
-
Duration
session
-
Description
The cookietest cookie is typically used to determine whether the user's browser accepts cookies, essential for website functionality and user experience.
-
Cookie
__Host-airtable-session
-
Duration
1 year
-
Description
This cookie is used to enable us to integrate the services of Airtable.
-
Cookie
__Host-airtable-session.sig
-
Duration
1 year
-
Description
This cookie is used to enable us to integrate the services of Airtable.
-
Cookie
m
-
Duration
1 year 1 month 4 days
-
Description
Stripe sets this cookie for fraud prevention purposes. It identifies the device used to access the website, allowing the website to be formatted accordingly.
-
Cookie
BIGipServer*
-
Duration
session
-
Description
Marketo sets this cookie to collect information about the user's online activity and build a profile about their interests to provide advertisements relevant to the user.
-
Cookie
__cfruid
-
Duration
session
-
Description
Cloudflare sets this cookie to identify trusted web traffic.
-
Cookie
_GRECAPTCHA
-
Duration
6 months
-
Description
Google Recaptcha service sets this cookie to identify bots to protect the website against malicious spam attacks.
-
Cookie
__Secure-YNID
-
Duration
6 months
-
Description
Google cookie used to protect user security and prevent fraud, especially during the login process.
-
Cookie
cookieyes-consent
-
Duration
1 year
-
Description
CookieYes sets this cookie to remember users' consent preferences so that their preferences are respected on subsequent visits to this site. It does not collect or store any personal information about the site visitors.
Functional
Functional cookies help perform certain functionalities like sharing the content of the website on social media platforms, collecting feedback, and other third-party features.
-
Cookie
lidc
-
Duration
1 day
-
Description
LinkedIn sets the lidc cookie to facilitate data center selection.
-
Cookie
brw
-
Duration
1 year
-
Description
No description available.
-
Cookie
brwConsent
-
Duration
5 minutes
-
Description
Description is currently not available.
-
Cookie
WMF-Uniq
-
Duration
1 year
-
Description
Description is currently not available.
-
Cookie
loom_anon_comment
-
Duration
1 year
-
Description
No description available.
-
Cookie
loom_referral_video
-
Duration
session
-
Description
Description is currently not available.
-
Cookie
VISITOR_INFO1_LIVE
-
Duration
6 months
-
Description
A cookie set by YouTube to measure bandwidth that determines whether the user gets the new or old player interface.
-
Cookie
yt-remote-connected-devices
-
Duration
Never Expires
-
Description
YouTube sets this cookie to store the user's video preferences using embedded YouTube videos.
-
Cookie
ytidb::LAST_RESULT_ENTRY_KEY
-
Duration
Never Expires
-
Description
The cookie ytidb::LAST_RESULT_ENTRY_KEY is used by YouTube to store the last search result entry that was clicked by the user. This information is used to improve the user experience by providing more relevant search results in the future.
-
Cookie
yt-remote-device-id
-
Duration
Never Expires
-
Description
YouTube sets this cookie to store the user's video preferences using embedded YouTube videos.
-
Cookie
yt-remote-session-name
-
Duration
session
-
Description
The yt-remote-session-name cookie is used by YouTube to store the user's video player preferences using embedded YouTube video.
-
Cookie
yt-remote-fast-check-period
-
Duration
session
-
Description
The yt-remote-fast-check-period cookie is used by YouTube to store the user's video player preferences for embedded YouTube videos.
-
Cookie
yt-remote-session-app
-
Duration
session
-
Description
The yt-remote-session-app cookie is used by YouTube to store user preferences and information about the interface of the embedded YouTube video player.
-
Cookie
yt-remote-cast-available
-
Duration
session
-
Description
The yt-remote-cast-available cookie is used to store the user's preferences regarding whether casting is available on their YouTube video player.
-
Cookie
yt-remote-cast-installed
-
Duration
session
-
Description
The yt-remote-cast-installed cookie is used to store the user's video player preferences using embedded YouTube video.
-
Cookie
cp_session
-
Duration
3 months
-
Description
Codepen sets this cookie for Help systems found in the website.
-
Cookie
loid
-
Duration
1 year 1 month 4 days
-
Description
This cookie is set by the Reddit. The cookie enables the sharing of content from the website onto the social media platform.
Analytics
Analytical cookies are used to understand how visitors interact with the website. These cookies help provide information on metrics such as the number of visitors, bounce rate, traffic source, etc.
-
Cookie
__hstc
-
Duration
6 months
-
Description
Hubspot set this main cookie for tracking visitors. It contains the domain, initial timestamp (first visit), last timestamp (last visit), current timestamp (this visit), and session number (increments for each subsequent session).
-
Cookie
hubspotutk
-
Duration
6 months
-
Description
HubSpot sets this cookie to keep track of the visitors to the website. This cookie is passed to HubSpot on form submission and used when deduplicating contacts.
-
Cookie
_ga
-
Duration
1 year 1 month 4 days
-
Description
Google Analytics sets this cookie to calculate visitor, session and campaign data and track site usage for the site's analytics report. The cookie stores information anonymously and assigns a randomly generated number to recognise unique visitors.
-
Cookie
ga*
-
Duration
1 year 1 month 4 days
-
Description
Google Analytics sets this cookie to store and count page views.
-
Cookie
__Host-psifi.analyticsTrace
-
Duration
6 hours
-
Description
Description is currently not available.
-
Cookie
__Host-psifi.analyticsTraceV2
-
Duration
6 hours
-
Description
Description is currently not available.
-
Cookie
_gh_sess
-
Duration
session
-
Description
GitHub sets this cookie for temporary application and framework state between pages like what step the user is on in a multiple step form.
-
Cookie
YSC
-
Duration
session
-
Description
YSC cookie is set by Youtube and is used to track the views of embedded videos on Youtube pages.
-
Cookie
ajs_anonymous_id
-
Duration
1 year
-
Description
This cookie is set by Segment to count the number of people who visit a certain site by tracking if they have visited before.
-
Cookie
vuid
-
Duration
1 year 1 month 4 days
-
Description
Vimeo installs this cookie to collect tracking information by setting a unique ID to embed videos on the website.
Performance
Performance cookies are used to understand and analyse the key performance indexes of the website which helps in delivering a better user experience for the visitors.
-
Cookie
AWSALB
-
Duration
7 days
-
Description
AWSALB is an application load balancer cookie set by Amazon Web Services to map the session to the target.
-
Cookie
acq
-
Duration
past
-
Description
Description is currently not available.
-
Cookie
acq.sig
-
Duration
past
-
Description
Description is currently not available.
-
Cookie
ptc
-
Duration
2 years
-
Description
No description available.
Advertisement
Advertisement cookies are used to provide visitors with customised advertisements based on the pages you visited previously and to analyse the effectiveness of the ad campaigns.
-
Cookie
muc_ads
-
Duration
1 year 1 month 4 days
-
Description
Twitter sets this cookie to collect user behaviour and interaction data to optimize the website.
-
Cookie
guest_id_marketing
-
Duration
1 year 1 month 4 days
-
Description
Twitter sets this cookie to identify and track the website visitor.
-
Cookie
guest_id_ads
-
Duration
1 year 1 month 4 days
-
Description
Twitter sets this cookie to identify and track the website visitor.
-
Cookie
personalization_id
-
Duration
1 year 1 month 4 days
-
Description
Twitter sets this cookie to integrate and share features for social media and also store information about how the user uses the website, for tracking and targeting.
-
Cookie
guest_id
-
Duration
1 year 1 month 4 days
-
Description
Twitter sets this cookie to identify and track the website visitor. It registers if a user is signed in to the Twitter platform and collects information about ad preferences.
-
Cookie
bcookie
-
Duration
1 year
-
Description
LinkedIn sets this cookie from LinkedIn share buttons and ad tags to recognize browser IDs.
-
Cookie
__Secure-ROLLOUT_TOKEN
-
Duration
6 months
-
Description
YouTube sets this cookie to manage feature rollout and experimentation. It helps Google control which new features or interface changes are shown to users as part of testing and staged rollouts, ensuring consistent experience for a given user during an experiment.
-
Cookie
yt.innertube::nextId
-
Duration
Never Expires
-
Description
YouTube sets this cookie to register a unique ID to store data on what videos from YouTube the user has seen.
-
Cookie
yt.innertube::requests
-
Duration
Never Expires
-
Description
YouTube sets this cookie to register a unique ID to store data on what videos from YouTube the user has seen.
-
Cookie
session_tracker
-
Duration
session
-
Description
This cookie is set by the Reddit. This cookie is used to identify trusted web traffic. It also helps in adverstising on the website.
-
Cookie
edgebucket
-
Duration
session
-
Description
Reddit sets this cookie to save the information about a log-on Reddit user, for the purpose of advertisement recommendations and updating the content.
-
Cookie
did
-
Duration
1 year
-
Description
Arbor sets this cookie to show targeted ads to site visitors.This cookie expires after 2 months or 1 year.
Uncategorised
Other uncategorised cookies are those that are being analysed and have not been classified into a category as yet.
No cookies to display.
Reject All Save My Preferences Accept All
Toggle SearchToggle Mobile Navigation
Publish AI, ML & data-science insights to a global community of data professionals.
Sign inSubmit an Article
LatestEditor's PicksNewsletterShipAI
Write For TDS
LinkedInXToggle Search
Data Science
EDA in Public (Part 2): Product Deep Dive & Time-Series Analysis in Pandas
Learn how to analyze product performance, extract time-series features, and uncover key seasonal trends in your sales data.
Ibrahim Salami
December 20, 20259 min read
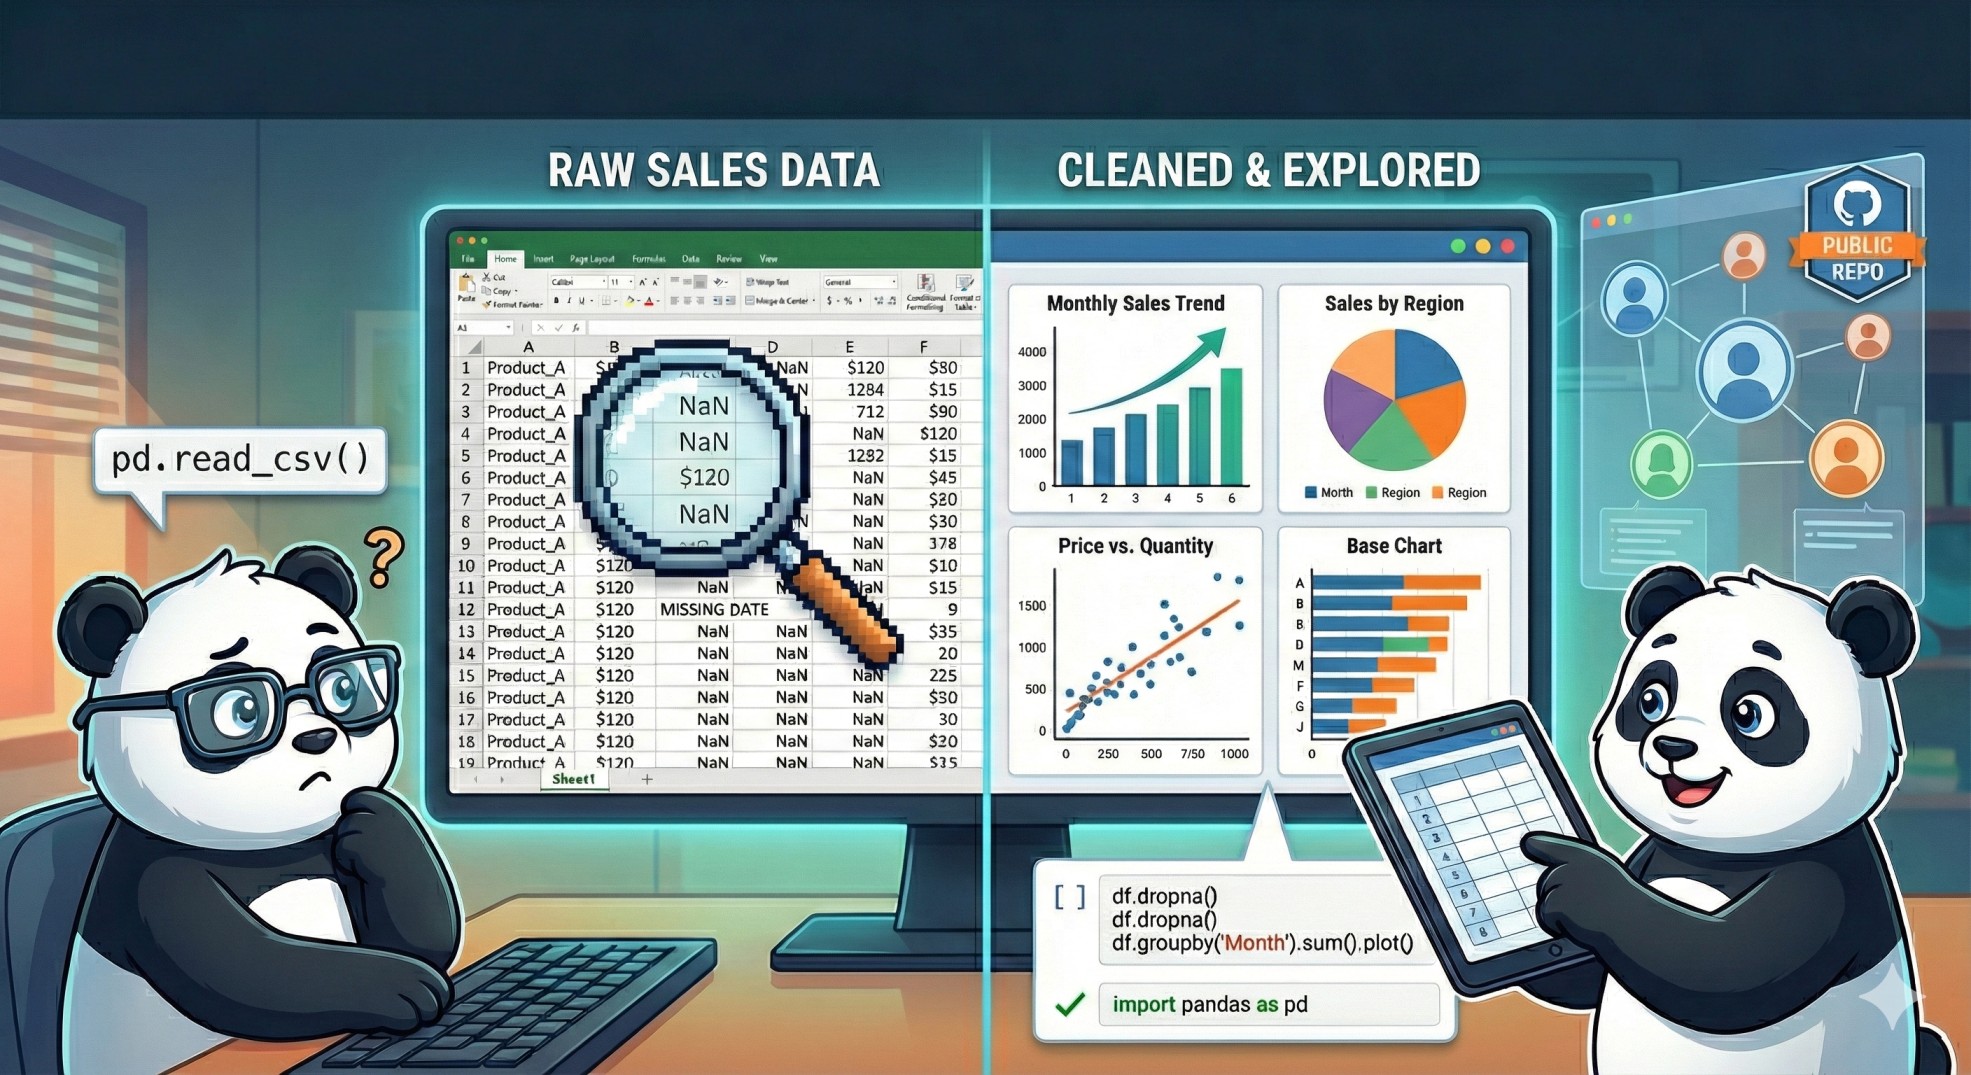 Image by Author. Created with Gemini
Hi everyone! Welcome back to the “EDA in Public” series! This is Part 2 of the series; if you haven’t seen Part 1 yet, read it here. Here’s a recap of what we conquered.
EDA in Public (Part 1): Cleaning and Exploring Sales Data with PandasLearn how to clean messy CSVs, summarize data, and visualize basic trends in e-commerce sales.Ibrahim Salami · 10 min read
In Part 1, we took a messy, half-million-row sales file and got it into shape. Specifically, we:
- Sampled the data for faster processing.
- Fixed missing values and standardised text entries (like ‘EIRE’ to ‘Ireland’).
- Filtered out all the noise — returns, cancellations, and transactions with zero price.
- Engineered our most critical feature: the
Revenue column.
- Achieved our first business insight: the Top 10 Revenue-Generating Countries.
We now have a clean, revenue-ready Pandas DataFrame ready to be exploited for insights! By the end of this series, I want to have mastered exploratory data analysis using Pandas. Feel free to follow along if you’re a data enthusiast.
Learn this step by step with the interactive AI and Data Scientist roadmap.
Now we shift our focus to delivering truly impactful business intelligence for NovaShop. Our overall goal for Part 2 is to answer the fundamental questions: What products are the best performers, and when is the best time to sell them?
This part is all about analysis using powerful Pandas aggregation techniques (.groupby()) and feature engineering using the datetime column (.dt accessor). We'll break down our analysis into two key areas:
- Product Deep Dive: Identifying the products that move the most units versus those that bring in the most cash.
- Sales Timing (Time-Series): Uncovering the seasonality of sales (monthly peaks) and the operational trends (busiest hour of the day).
Without further ado, let’s get to it.
Loading the clean data
To improve performance, let’s export our cleaned dataset and import it again for analysis
python
df.to_csv('online_retail_clean.csv', index=False)
Now, I can create a new project and start afresh.
When loading CSVs that contain date columns, I try to use the parse_dates argument in pd.read_csv(). This saves me the step of manually converting the column type later, ensuring the date features are correct from the start.
python
import pandas as pd
df = pd.read_csv('online_retail_clean.csv', parse_dates=['InvoiceDate'])
print(f"Successfully loaded clean data. Total rows: {len(df)}")
Output:
markup
Successfully loaded clean data. Total rows: 52933
Product Deep Dive: Who Are the True Money Makers?
With the clean data loaded, let’s jump straight into product performance. Products can be considered "best-sellers" in two different ways: by volume (units sold) or by value (revenue generated).
Insight 2: Top 10 Bestsellers (by Quantity)
The quantity list tells us which products are popular and in high demand, even if their price is low. This is important for warehouse stocking and inventory management.
We’ll group by the product Description, sum the Quantity, and sort it descendingly.
python
# Top 10 Bestsellers (by Quantity)
df.groupby(‘Description’)[‘Quantity’].sum().sort_values(ascending=False).head(10)
Output:
markup
DescriptionMEDIUM CERAMIC TOP STORAGE JAR 74698WORLD WAR 2 GLIDERS ASSTD DESIGNS 9419GIN + TONIC DIET METAL SIGN 5016ASSORTED COLOURS SILK FAN 4684JUMBO BAG RED RETROSPOT 4671PACK OF 72 RETROSPOT CAKE CASES 3561MINI PAINT SET VINTAGE 3285ASSORTED COLOUR BIRD ORNAMENT 2783BROCADE RING PURSE 2525POPCORN HOLDER 2508Name: Quantity, dtype: int64
Insight 3: Top 10 Revenue Drivers (The True Money-Makers)
This is what NovaShop really wants to know. These products drive profitability. They might not sell as many units as the items in the previous list, but their higher price or larger bulk orders make them far more valuable.
We follow the same process, but this time we aggregate on the Revenue column we engineered in Part 1.
python
# Top 10 Revenue Drivers (The True Money-Makers)
df.groupby(‘Description’)[‘Revenue’].sum().sort_values(ascending=False).head(10)
Output:
markup
DescriptionMEDIUM CERAMIC TOP STORAGE JAR 77785.74DOTCOM POSTAGE 18456.13REGENCY CAKESTAND 3 TIER 15093.38AMAZON FEE 13541.33PARTY BUNTING 9491.60GIN + TONIC DIET METAL SIGN 9480.51JUMBO BAG RED RETROSPOT 8996.65Manual 8966.96CHILLI LIGHTS 8395.20POSTAGE 7194.51Name: Revenue, dtype: float64
Discussion: What These Lists Tell NovaShop
This is where the power of EDA truly shines, because these two lists tell a very different story:
- The All-Star Product: The “MEDIUM CERAMIC TOP STORAGE JAR” is clearly the winner, dominating both lists by a massive margin. It’s high volume and high value. This item should be NovaShop’s primary focus for inventory, marketing, and expansion.
- A surprising revenue source: While exploring the data, I noticed items like “DOTCOM POSTAGE,” “AMAZON FEE,” “Manual,” and “POSTAGE.” These aren’t actual products — they’re service fees and manual adjustments. Yet together, they bring in almost £48,000 in revenue. NovaShop should double-check whether these fees are being counted in their gross profit. It’s an easy thing to miss, but it could be a quiet and meaningful source of income hiding in plain sight.
- The High-Value Physical Goods: Items like the “REGENCY CAKESTAND 3 TIER” and “CHILLI LIGHTS” make the revenue list but not the quantity list. This tells us they are high-price items that contribute significantly to the total cash flow, and they are worth targeted marketing efforts.
We now have a complete picture of what NovaShop sells best. Time to figure out when!
Preparing for Time-Series Analysis: Feature Engineering
We know what sold well. Now, let’s figure out when sales peak. Our goal is to break down the InvoiceDate column into components that allow us to group and analyze sales by year, month, day, and even hour.
This is a classic feature engineering move. Since we already made sure InvoiceDate is a proper Pandas datetime object (thanks to parse_dates in our loading step!), we can use the extremely useful .dt accessor.
Extracting Time Components
To understand seasonality (monthly) and operational efficiency (hourly), we’ll create four new columns.
- Year — For long-term comparisons
- Month — For identifying seasonal peaks (e.g., Q4 rush).
- DayName — To find the busiest day of the week.
- Hour — To determine peak operational hours.
Let’s generate these columns:
python
print(“\n — — Time Series Feature Extraction — -”)

# Extract Year, Month, DayName, and Hour from the InvoiceDate column
df[‘Year’] = df[‘InvoiceDate’].dt.year
df[‘Month’] = df[‘InvoiceDate’].dt.month
df[‘DayName’] = df[‘InvoiceDate’].dt.day_name()
df[‘Hour’] = df[‘InvoiceDate’].dt.hour
print(“New time features added: Year, Month, DayName, Hour.”)
print(df[[‘InvoiceDate’, ‘Year’, ‘Month’, ‘DayName’, ‘Hour’]].head())
Output:
markup
--- Time Series Feature Extraction ---New time features added: Year, Month, DayName, Hour.InvoiceDate Year Month DayName Hour0 2011-06-01 12:05:00 2011 6 Wednesday 121 2011-05-27 17:14:00 2011 5 Friday 172 2011-04-21 17:05:00 2011 4 Thursday 173 2011-11-16 10:39:00 2011 11 Wednesday 104 2011-03-10 08:40:00 2011 3 Thursday 8
Perfect! We can move right into mapping the sales patterns in the next section.
Mapping Sales Patterns (Time-Series Insights)
With our time features ready, we can now ask and answer our questions about when sales occur. We’ll start big (monthly trends) and drill down small (hourly trends).
Insight 4: Sales Trends by Month (Seasonality)
Monthly aggregation is crucial for spotting seasonality — the predictable pattern of sales repeating every year. This data is used for financial forecasting and planning inventory levels for the peak season.
We’ll group by the Month column and calculate the total revenue for each.
python
print(“\n — — Insight 4: Sales Trends by Month (Seasonality) — -”)
# Group by month and sum the revenue
monthly_revenue = df.groupby(‘Month’)[‘Revenue’].sum().sort_values(ascending=False)
# Print the results, which should show the seasonal peaks
print(monthly_revenue)
Output:
markup
--- Insight 4: Sales Trends by Month (Seasonality) ---Month11 143576.3601 142013.42012 133178.98010 119533.5409 103929.4203 72968.2708 71302.8905 70424.5106 68722.5207 68713.8314 51882.0102 50178.730Name: Revenue, dtype: float64
Interpretation: The Massive Q4 and January Surprise
The data clearly shows that NovaShop’s sales are heavily skewed toward the end of the year, confirming the typical retail Q4 (October, November, December) rush.
- Peak Season: November is the peak month by a slight margin, followed closely by December. This is the time to stock up on the Medium Ceramic Top Storage Jars and run targeted ads.
- The January Surge: The second-highest month is January! This is an excellent insight for NovaShop. It suggests customers may be using Christmas gift money or taking advantage of post-holiday sales. This period should not be treated as a slump but as a secondary high-volume sales opportunity.
- Low Season: February and April are the lowest performers, which helps NovaShop plan for lower staffing and marketing budgets during those periods.
Insight 5: Sales Trends by Day of Week and Hour (Operational Planning)
While seasonality is about finance and inventory, daily and hourly trends are about operations. NovaShop can use this to schedule warehouse staff, optimize ad spend, and time email campaigns.
We’ll run two separate aggregations here: one for the day of the week and one for the hour of the day.
Revenue by Day of Week
python
# 1. Sales by Day of Week
daily_revenue = df.groupby(‘DayName’)[‘Revenue’].sum()
print(“\n — — Revenue by Day of Week — -”)
print(daily_revenue)
Output:
markup
--- Revenue by Day of Week ---DayNameFriday 163861.320Monday 171026.230Sunday 83125.890Thursday 219342.980Tuesday 282796.741Wednesday 176271.320Name: Revenue, dtype: float64
Interpretation: Tuesday is the Power Day
The data reveals a clear and actionable pattern for the work week:
- Peak Sales : Tuesday absolutely dominates the week, generating almost 30% more revenue than the next busiest day, Thursday. This is a prime day for launching new products or running high-impact flash sales.
- Slump Days: Unsurprisingly, sales drop dramatically on Sunday. NovaShop might consider this a low-priority day for email marketing or customer service staffing.
- Missing Day: The dataset contains no transactions for Saturday in our sample (or perhaps the full set, which is common in B2B datasets).
Revenue by Hour of Day
python
# 2. Sales by Hour of Day
hourly_revenue = df.groupby(‘Hour’)[‘Revenue’].sum().sort_index()
print(“\n — — Revenue by Hour of Day — -”)
print(hourly_revenue)
Output:
markup
--- Revenue by Hour of Day ---Hour7 2830.9108 26597.8009 76768.75010 209809.97111 115233.60012 142474.46013 130348.29014 119241.52015 145178.98016 70620.55017 36148.03018 14022.79019 4397.13020 2751.700
Interpretation: The Late Morning Boom
The hourly data points directly to operational needs:
- Massive Peak: Sales explode at 10 AM (Hour 10), generating almost double the revenue of the next few hours. This is the optimal time for NovaShop to launch email marketing and social media campaigns.
- Sustained Activity: Sales remain high from 11 AM through 3 PM, suggesting a strong midday and post-lunch shopping window.
- End of Day: Activity falls off sharply after 4 PM, with very little revenue generated in the evening (7 PM onward). This indicates NovaShop’s customer base is primarily desk-based, shopping during traditional working hours.
Conclusion: Setting the Stage for Customer Segmentation
We have officially finished the heavy-duty EDA! We know what sells best (the Ceramic Jar and fees), where sales are strongest (the UK), and when the sales peaks occur (Q4, Tuesdays, and 10 AM).
However, we are still missing the most valuable piece of the puzzle: The Who. The best companies don’t just know what sells; they know who their most valuable customers are and how to keep them.
In Part 3, we will dive into the most advanced analysis technique in this series: RFM (Recency, Frequency, Monetary) Customer Segmentation. This will allow us to classify customers into tiers like “Champions,” “Loyal Customers,” and “At-Risk,” giving NovaShop a true roadmap for personalised marketing.
I hope you found this article helpful. Feel free to say hi to me on any of these platforms. I truly appreciate your feedback.
Medium
LinkedIn
Twitter
YouTube
Register Now to Continue Reading
Unlock Towards Data Science with a Free Account
All articles on Towards Data Science are available to registered users. Create a free account today to access this article and thousands more.
Register for freeSign in to your account
 Written By
See all from Ibrahim Salami
Exploratory Data AnalysisMachine LearningPandasProgrammingPython
Share This Article
Towards Data Science is a community publication. Submit your insights to reach our global audience and earn through the TDS Author Payment Program.
Write for TDS
Related Articles
Machine Learning
Sophisticated models look good on research papers but might not pay off in business use cases
Fabio Baccarin
December 28, 202014 min read
Machine Learning
Walkthrough of the data science interview funnel and steps to get your first offer
Alex Vamvakaris
March 23, 202312 min read
Artificial Intelligence
Here are some tips for preparing for your next data science interviews.
Lai Woen Yon
August 15, 202118 min read
Programming
An introductory tutorial for Orbit (Object-Oriented Bayesian Time Series Forecasting)
Ariel Jiang
April 28, 202212 min read
Data Science
A roadmap to avoiding the "default path" and finding fulfilment in work
Matt Chapman
November 2, 20237 min read
Machine Learning
Notes on Risk, Reward and Ruin in Stochastic Games
Douglas Hamilton
May 24, 20218 min read
Machine Learning
There are a lot of engineers who have never been involved in the field of...
Kirill Bobrov
May 12, 20219 min read
Programming
Hot to log Breadcrumbs using Python's built-int logging package
Mike Huls
November 5, 20245 min read
Machine Learning
A non-inferiority test proves that a new treatment is not worse than the standard by more than a clinically acceptable margin
Prateek Jain
October 18, 20245 min read
Your home for data science and AI. The world's leading publication for data science, data analytics, data engineering, machine learning, and artificial intelligence professionals.
Subscribe to Our NewsletterWrite For TDS•About•Advertise•Privacy Policy•Terms of Use
© Insight Media Group, LLC 2026•The New Stack•roadmap.sh•Creator Network
Recommended Articles
Close