An Introductory Overview of Unsupervised Learning

In the supervised learning series, we learned how models use labeled data to make predictions where both inputs and outputs are known. But what if we only have raw data, with no labels or outcomes defined?
That’s where Unsupervised Learning comes in.
It’s a type of machine learning that helps us discover hidden patterns, relationships, and structures in data without any predefined categories or human guidance.
What Is Unsupervised Learning?
Unsupervised learning algorithms work solely with input data, without any labeled responses.
Their main goal is to explore the data and find patterns that help us understand how information is grouped or related.
For example:
Imagine having thousands of animal photos but no labels like “cat,” “dog,” or “bird.”
An unsupervised algorithm can automatically group similar images together — all cats in one group, all dogs in another — purely by analyzing patterns in the data.

Types of Unsupervised Learning
While many resources introduce unsupervised learning mainly through clustering, the broader category actually includes three major types that includes clustering, association rule learning, and dimensionality reduction.
Clustering:
Groups similar data points together based on shared characteristics.
(**Example: grouping customers based on purchase behavior)Association Rule Learning:
Finds relationships and co-occurrences between features.
(Example: people who buy bread often buy butter)Dimensionality Reduction:
Simplifies complex datasets by reducing the number of features while keeping the important information.
(Example: compressing high-dimensional data for visualization or faster processing)
General Workflow of Unsupervised Learning
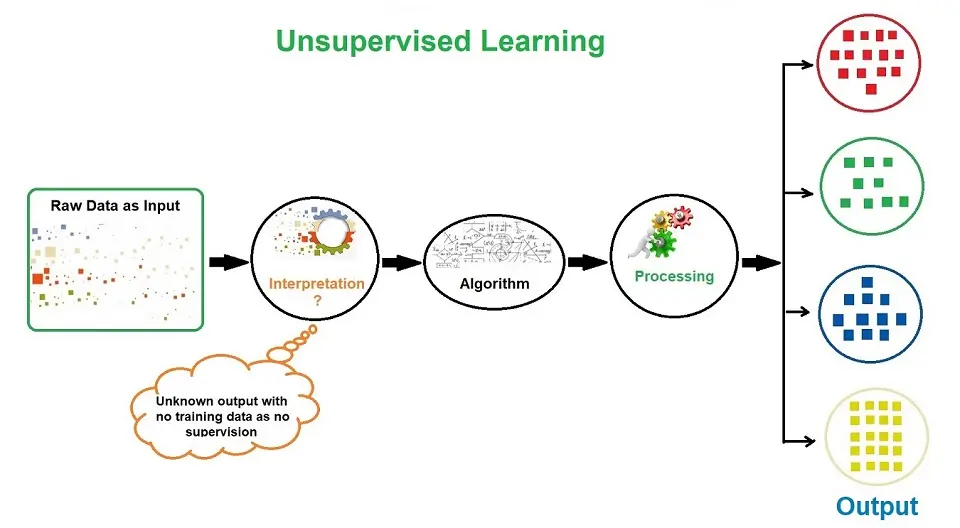
Here’s a simple step-by-step view of how an unsupervised learning algorithm works:
Collect Unlabeled Data
Gather data with no predefined outputs.
Example: customer profiles, images, sensor data.Choose the Right Algorithm
Depending on your goal — cluster similar data, find associations, or reduce dimensions — choose algorithms like K-Means, Apriori, or PCA.Train the Model
The algorithm analyzes the dataset and tries to find hidden structures, similarities, or groups — without any human supervision.Group or Transform Data
It organizes data into clusters, rules, or reduced forms for visualization or further use.Interpret the Results
The final step is understanding the results — identifying patterns, interpreting clusters, and gaining insights for decision-making.
Common Algorithms & Their Purpose
1. Clustering Algorithms
Used to group similar data points together.
K-Means Clustering: Divides data into k clusters based on distance between points.
Hierarchical Clustering: Builds clusters step by step like a tree.
DBSCAN: Finds clusters in dense regions and treats outliers as noise.
Mean-Shift & Spectral Clustering: Handle complex patterns and overlapping groups.
Example: Grouping customers by spending behavior in an e-commerce store.
2. Association Rule Learning
Finds interesting relationships between variables in a dataset.
Apriori Algorithm: Explores frequent itemsets step by step.
FP-Growth: Faster and more efficient for large datasets.
Example: In a supermarket dataset, finding that “customers who buy milk often buy cereal.”
3. Dimensionality Reduction
Simplifies data while keeping it meaningful.
PCA (Principal Component Analysis): Converts data into fewer “principal” components.
LDA, NMF, LLE: Different techniques to reduce complexity and visualize data.
Example: Reducing 1000 features in an image dataset to 2D for visualization.
Real-World Applications of Unsupervised Learning
Customer Segmentation: Grouping customers for personalized marketing.
Anomaly Detection: Detecting fraud or unusual patterns in financial transactions.
Recommendation Systems: Suggesting movies, songs, or products based on similarities.
Image & Text Clustering: Organizing untagged photos or documents.
Social Network Analysis: Identifying communities and trends online.
Example: Unsupervised Learning in Python
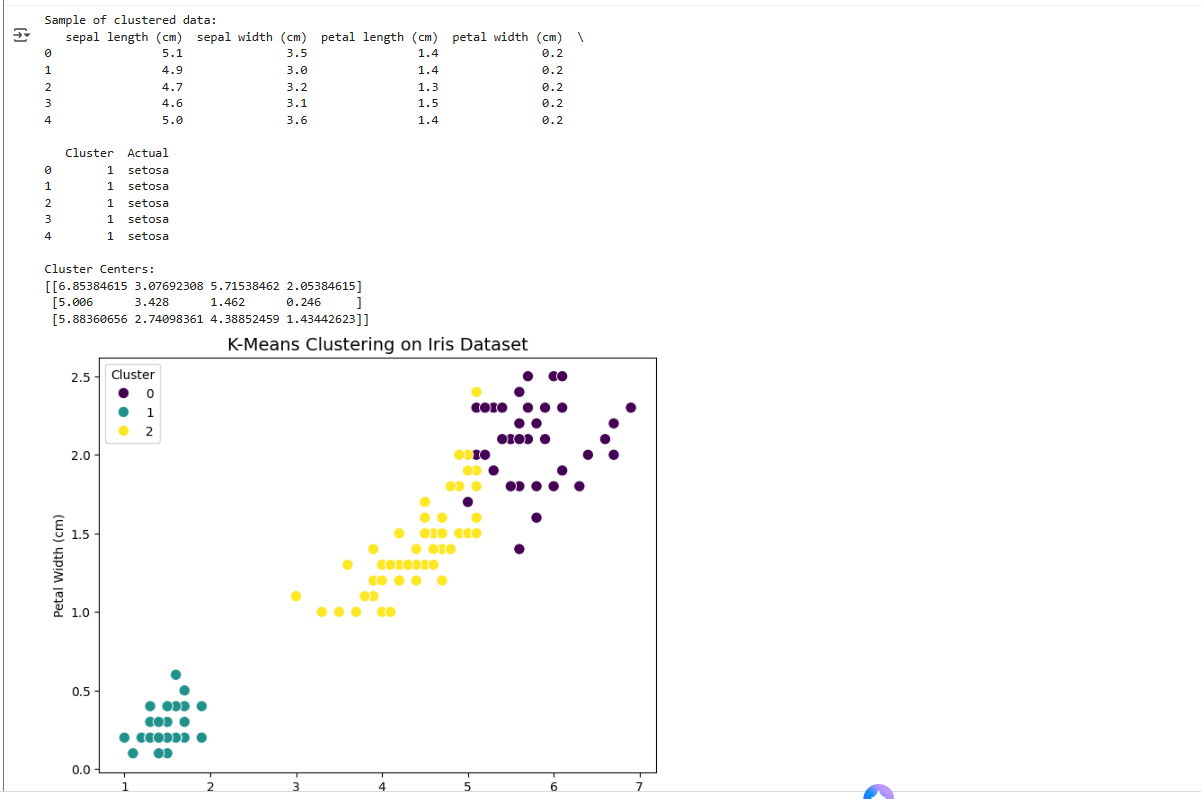
Let’s look at a simple K-Means Clustering example using the famous Iris dataset.
We’ll group flowers into clusters based on their petal and sepal measurements — without knowing their species labels.
# --- Import Required Libraries ---
import pandas as pd
import matplotlib.pyplot as plt
import seaborn as sns
from sklearn.datasets import load_iris
from sklearn.cluster import KMeans

# --- Load the Iris Dataset ---
data = load_iris()
X = pd.DataFrame(data.data, columns=data.feature_names)

# --- Apply K-Means Clustering ---
kmeans = KMeans(n_clusters=3, random_state=42)
kmeans.fit(X)

# --- Add Predicted Cluster Labels to the DataFrame ---
X['Cluster'] = kmeans.labels_

# --- Add Actual Species Names for Comparison ---
X['Actual'] = [data.target_names[i] for i in data.target]

# --- Display the First Few Rows of the Dataset ---
print("Sample of clustered data:")
print(X.head())
print("\nCluster Centers:")
print(kmeans.cluster_centers_)

# --- Visualization 1: K-Means Clusters ---
plt.figure(figsize=(8, 6))
sns.scatterplot(
    data=X,
    x='petal length (cm)',
    y='petal width (cm)',
    hue='Cluster',
    palette='viridis',
    s=80
)
plt.title("K-Means Clustering on Iris Dataset", fontsize=14)
plt.xlabel("Petal Length (cm)")
plt.ylabel("Petal Width (cm)")
plt.legend(title="Cluster", loc="upper left")
plt.show()

# --- Visualization 2: Actual Species ---
plt.figure(figsize=(8, 6))
sns.scatterplot(
    data=X,
    x='petal length (cm)',
    y='petal width (cm)',
    hue='Actual',
    palette='Set2',
    s=80
)
plt.title("Actual Iris Species", fontsize=14)
plt.xlabel("Petal Length (cm)")
plt.ylabel("Petal Width (cm)")
plt.legend(title="Species", loc="upper left")
plt.show()
Conclusion
Unsupervised Learning is all about exploration and discovery, finding what’s hidden in your data without explicit labels. It’s the foundation for clustering, pattern detection, and insights generation. In this new Unsupervised Learning series, we’ll go deeper into each category.
Stay tuned — next, we’ll explore how K-Means actually forms clusters and how to visualize them beautifully in Python.


