保留正文与补采附件。源页面当前未重新核验;具体限制见交付清单。
 We value your privacy
We use cookies to enhance your browsing experience, serve personalised ads or content, and analyse our traffic. By clicking "Accept All", you consent to our use of cookies.
Customise Reject All Accept All
Customise Consent Preferences
 We use cookies to help you navigate efficiently and perform certain functions. You will find detailed information about all cookies under each consent category below.
The cookies that are categorised as "Necessary" are stored on your browser as they are essential for enabling the basic functionalities of the site. ... Show more
NecessaryAlways Active
Necessary cookies are required to enable the basic features of this site, such as providing secure log-in or adjusting your consent preferences. These cookies do not store any personally identifiable data.
-
Cookie
BCTempID
-
Duration
10 minutes
-
Description
No description available.
-
Cookie
__cf_bm
-
Duration
1 hour
-
Description
This cookie, set by Cloudflare, is used to support Cloudflare Bot Management.
-
Cookie
AWSALBCORS
-
Duration
7 days
-
Description
Amazon Web Services set this cookie for load balancing.
-
Cookie
_cfuvid
-
Duration
session
-
Description
Cloudflare sets this cookie to track users across sessions to optimize user experience by maintaining session consistency and providing personalized services
-
Cookie
li_gc
-
Duration
6 months
-
Description
Linkedin set this cookie for storing visitor's consent regarding using cookies for non-essential purposes.
-
Cookie
__hssrc
-
Duration
session
-
Description
This cookie is set by Hubspot whenever it changes the session cookie. The __hssrc cookie set to 1 indicates that the user has restarted the browser, and if the cookie does not exist, it is assumed to be a new session.
-
Cookie
__hssc
-
Duration
1 hour
-
Description
HubSpot sets this cookie to keep track of sessions and to determine if HubSpot should increment the session number and timestamps in the __hstc cookie.
-
Cookie
wpEmojiSettingsSupports
-
Duration
session
-
Description
WordPress sets this cookie when a user interacts with emojis on a WordPress site. It helps determine if the user's browser can display emojis properly.
-
Cookie
BCSessionID
-
Duration
1 year 1 month 4 days
-
Description
Blueconic sets this cookie as a unique identifier for the BlueConic profile.
-
Cookie
_octo
-
Duration
1 year
-
Description
No description available.
-
Cookie
logged_in
-
Duration
1 year
-
Description
No description available.
-
Cookie
__Secure-YEC
-
Duration
past
-
Description
YouTube sets this cookie to stores the user's video player preferences using embedded YouTube video
-
Cookie
__eoi
-
Duration
6 months
-
Description
Description is currently not available.
-
Cookie
AWSALBTGCORS
-
Duration
7 days
-
Description
No description available.
-
Cookie
login-status-p
-
Duration
past
-
Description
Description is currently not available.
-
Cookie
AWSALBTG
-
Duration
7 days
-
Description
No description available.
-
Cookie
csrf_token
-
Duration
session
-
Description
No description available.
-
Cookie
token_v2
-
Duration
1 day
-
Description
Description is currently not available.
-
Cookie
D
-
Duration
1 year
-
Description
Description is currently not available.
-
Cookie
PHPSESSID
-
Duration
session
-
Description
This cookie is native to PHP applications. The cookie stores and identifies a user's unique session ID to manage user sessions on the website. The cookie is a session cookie and will be deleted when all the browser windows are closed.
-
Cookie
VISITOR_PRIVACY_METADATA
-
Duration
6 months
-
Description
YouTube sets this cookie to store the user's cookie consent state for the current domain.
-
Cookie
cookietest
-
Duration
session
-
Description
The cookietest cookie is typically used to determine whether the user's browser accepts cookies, essential for website functionality and user experience.
-
Cookie
__Host-airtable-session
-
Duration
1 year
-
Description
This cookie is used to enable us to integrate the services of Airtable.
-
Cookie
__Host-airtable-session.sig
-
Duration
1 year
-
Description
This cookie is used to enable us to integrate the services of Airtable.
-
Cookie
m
-
Duration
1 year 1 month 4 days
-
Description
Stripe sets this cookie for fraud prevention purposes. It identifies the device used to access the website, allowing the website to be formatted accordingly.
-
Cookie
BIGipServer*
-
Duration
session
-
Description
Marketo sets this cookie to collect information about the user's online activity and build a profile about their interests to provide advertisements relevant to the user.
-
Cookie
__cfruid
-
Duration
session
-
Description
Cloudflare sets this cookie to identify trusted web traffic.
-
Cookie
_GRECAPTCHA
-
Duration
6 months
-
Description
Google Recaptcha service sets this cookie to identify bots to protect the website against malicious spam attacks.
-
Cookie
__Secure-YNID
-
Duration
6 months
-
Description
Google cookie used to protect user security and prevent fraud, especially during the login process.
-
Cookie
cookieyes-consent
-
Duration
1 year
-
Description
CookieYes sets this cookie to remember users' consent preferences so that their preferences are respected on subsequent visits to this site. It does not collect or store any personal information about the site visitors.
Functional
Functional cookies help perform certain functionalities like sharing the content of the website on social media platforms, collecting feedback, and other third-party features.
-
Cookie
lidc
-
Duration
1 day
-
Description
LinkedIn sets the lidc cookie to facilitate data center selection.
-
Cookie
brw
-
Duration
1 year
-
Description
No description available.
-
Cookie
brwConsent
-
Duration
5 minutes
-
Description
Description is currently not available.
-
Cookie
WMF-Uniq
-
Duration
1 year
-
Description
Description is currently not available.
-
Cookie
loom_anon_comment
-
Duration
1 year
-
Description
No description available.
-
Cookie
loom_referral_video
-
Duration
session
-
Description
Description is currently not available.
-
Cookie
VISITOR_INFO1_LIVE
-
Duration
6 months
-
Description
A cookie set by YouTube to measure bandwidth that determines whether the user gets the new or old player interface.
-
Cookie
yt-remote-connected-devices
-
Duration
Never Expires
-
Description
YouTube sets this cookie to store the user's video preferences using embedded YouTube videos.
-
Cookie
ytidb::LAST_RESULT_ENTRY_KEY
-
Duration
Never Expires
-
Description
The cookie ytidb::LAST_RESULT_ENTRY_KEY is used by YouTube to store the last search result entry that was clicked by the user. This information is used to improve the user experience by providing more relevant search results in the future.
-
Cookie
yt-remote-device-id
-
Duration
Never Expires
-
Description
YouTube sets this cookie to store the user's video preferences using embedded YouTube videos.
-
Cookie
yt-remote-session-name
-
Duration
session
-
Description
The yt-remote-session-name cookie is used by YouTube to store the user's video player preferences using embedded YouTube video.
-
Cookie
yt-remote-fast-check-period
-
Duration
session
-
Description
The yt-remote-fast-check-period cookie is used by YouTube to store the user's video player preferences for embedded YouTube videos.
-
Cookie
yt-remote-session-app
-
Duration
session
-
Description
The yt-remote-session-app cookie is used by YouTube to store user preferences and information about the interface of the embedded YouTube video player.
-
Cookie
yt-remote-cast-available
-
Duration
session
-
Description
The yt-remote-cast-available cookie is used to store the user's preferences regarding whether casting is available on their YouTube video player.
-
Cookie
yt-remote-cast-installed
-
Duration
session
-
Description
The yt-remote-cast-installed cookie is used to store the user's video player preferences using embedded YouTube video.
-
Cookie
cp_session
-
Duration
3 months
-
Description
Codepen sets this cookie for Help systems found in the website.
-
Cookie
loid
-
Duration
1 year 1 month 4 days
-
Description
This cookie is set by the Reddit. The cookie enables the sharing of content from the website onto the social media platform.
Analytics
Analytical cookies are used to understand how visitors interact with the website. These cookies help provide information on metrics such as the number of visitors, bounce rate, traffic source, etc.
-
Cookie
__hstc
-
Duration
6 months
-
Description
Hubspot set this main cookie for tracking visitors. It contains the domain, initial timestamp (first visit), last timestamp (last visit), current timestamp (this visit), and session number (increments for each subsequent session).
-
Cookie
hubspotutk
-
Duration
6 months
-
Description
HubSpot sets this cookie to keep track of the visitors to the website. This cookie is passed to HubSpot on form submission and used when deduplicating contacts.
-
Cookie
_ga
-
Duration
1 year 1 month 4 days
-
Description
Google Analytics sets this cookie to calculate visitor, session and campaign data and track site usage for the site's analytics report. The cookie stores information anonymously and assigns a randomly generated number to recognise unique visitors.
-
Cookie
ga*
-
Duration
1 year 1 month 4 days
-
Description
Google Analytics sets this cookie to store and count page views.
-
Cookie
__Host-psifi.analyticsTrace
-
Duration
6 hours
-
Description
Description is currently not available.
-
Cookie
__Host-psifi.analyticsTraceV2
-
Duration
6 hours
-
Description
Description is currently not available.
-
Cookie
_gh_sess
-
Duration
session
-
Description
GitHub sets this cookie for temporary application and framework state between pages like what step the user is on in a multiple step form.
-
Cookie
YSC
-
Duration
session
-
Description
YSC cookie is set by Youtube and is used to track the views of embedded videos on Youtube pages.
-
Cookie
ajs_anonymous_id
-
Duration
1 year
-
Description
This cookie is set by Segment to count the number of people who visit a certain site by tracking if they have visited before.
-
Cookie
vuid
-
Duration
1 year 1 month 4 days
-
Description
Vimeo installs this cookie to collect tracking information by setting a unique ID to embed videos on the website.
Performance
Performance cookies are used to understand and analyse the key performance indexes of the website which helps in delivering a better user experience for the visitors.
-
Cookie
AWSALB
-
Duration
7 days
-
Description
AWSALB is an application load balancer cookie set by Amazon Web Services to map the session to the target.
-
Cookie
acq
-
Duration
past
-
Description
Description is currently not available.
-
Cookie
acq.sig
-
Duration
past
-
Description
Description is currently not available.
-
Cookie
ptc
-
Duration
2 years
-
Description
No description available.
Advertisement
Advertisement cookies are used to provide visitors with customised advertisements based on the pages you visited previously and to analyse the effectiveness of the ad campaigns.
-
Cookie
muc_ads
-
Duration
1 year 1 month 4 days
-
Description
Twitter sets this cookie to collect user behaviour and interaction data to optimize the website.
-
Cookie
guest_id_marketing
-
Duration
1 year 1 month 4 days
-
Description
Twitter sets this cookie to identify and track the website visitor.
-
Cookie
guest_id_ads
-
Duration
1 year 1 month 4 days
-
Description
Twitter sets this cookie to identify and track the website visitor.
-
Cookie
personalization_id
-
Duration
1 year 1 month 4 days
-
Description
Twitter sets this cookie to integrate and share features for social media and also store information about how the user uses the website, for tracking and targeting.
-
Cookie
guest_id
-
Duration
1 year 1 month 4 days
-
Description
Twitter sets this cookie to identify and track the website visitor. It registers if a user is signed in to the Twitter platform and collects information about ad preferences.
-
Cookie
bcookie
-
Duration
1 year
-
Description
LinkedIn sets this cookie from LinkedIn share buttons and ad tags to recognize browser IDs.
-
Cookie
__Secure-ROLLOUT_TOKEN
-
Duration
6 months
-
Description
YouTube sets this cookie to manage feature rollout and experimentation. It helps Google control which new features or interface changes are shown to users as part of testing and staged rollouts, ensuring consistent experience for a given user during an experiment.
-
Cookie
yt.innertube::nextId
-
Duration
Never Expires
-
Description
YouTube sets this cookie to register a unique ID to store data on what videos from YouTube the user has seen.
-
Cookie
yt.innertube::requests
-
Duration
Never Expires
-
Description
YouTube sets this cookie to register a unique ID to store data on what videos from YouTube the user has seen.
-
Cookie
session_tracker
-
Duration
session
-
Description
This cookie is set by the Reddit. This cookie is used to identify trusted web traffic. It also helps in adverstising on the website.
-
Cookie
edgebucket
-
Duration
session
-
Description
Reddit sets this cookie to save the information about a log-on Reddit user, for the purpose of advertisement recommendations and updating the content.
-
Cookie
did
-
Duration
1 year
-
Description
Arbor sets this cookie to show targeted ads to site visitors.This cookie expires after 2 months or 1 year.
Uncategorised
Other uncategorised cookies are those that are being analysed and have not been classified into a category as yet.
No cookies to display.
Reject All Save My Preferences Accept All
Toggle SearchToggle Mobile Navigation
Publish AI, ML & data-science insights to a global community of data professionals.
Sign inSubmit an Article
LatestEditor's PicksNewsletterShipAI
Write For TDS
LinkedInXToggle Search
Data Science
Logistic Regression
Or how I learned to love the sigmoid "squishification" function for categorical data classification
James Andrew Godwin
April 13, 20215 min read
 Logistic Regression | Photo by Denise Bossarte
This article is a brief continuation of my regression series.
So far the regression examples I have been illustrating have been numeric, of numbers: predicting a continuous variable. With the Galton family height dataset, we were predicting children's height - a continuously varying parameter. Yet, note how a regression line fails to fit a binary outcome, a classification example:
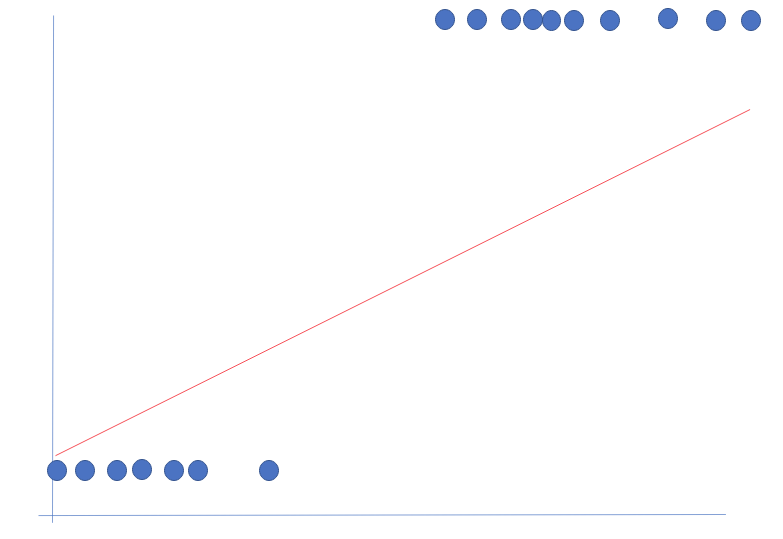 Line of best fit for binary outcomes
In the above example, there appears to be a threshold affecting the classification outcomes. It does not make sense to have a continuous regression line for this data. Why does it not make sense? Look at the two dependent (y) variables: they take on one of two values: 0 and 1. There is no value for 0.25 or 0.5, just those two extrema. This means that for this classification problem we want a function that takes as an input, or a series of inputs, and gives us a probability of it being one of the two classes: namely 0 and 1. We can give any arbitrary label to these classes: yes or no, cat or not cat, send a promotional email or do not send a promotional email, sales lead or unlikely sales lead.
Logistic regression is a powerful tool for data scientists and machine learning engineers alike. I would say, for sanity checks, that it should be the baseline model for classification purposes - one that is compared against more complex models (like PCR, neural networks, etc).
History
- Developed as a model for population growth, the term logistic came from Belgian mathematician Pierre François Verhulst, who died young and in relative obscurity
- The logistic function was independently developed in chemistry as a model of autocatalysis by German chemist Wilhelm Ostwald (1883)
- The logistic function was independently rediscovered as a model of population growth in 1920 by Americans Raymond Pearl and Lowell Reed, which led to its use in modern statistics. They were unaware of Verhulst earlier discovery but they gave him little credit and did not adopt his terminology
- The probit model was developed in the mid 1930's, generally credited to American biologist Chester Bliss
- The multinomial logit model was introduced independently in David Cox (1966) and Henri Thiel (1969)
Logistic regression
To get to logistic regression, we first begin with our classic regression example:
 Classic regression
To develop a model for classification we will borrow the sigmoid function from math, commonly expressed below as:
 Sigmoid formula
Rearranging and substituting into the regression:
 Formula for logistic regression
What this family of functions does is give a probability of assigning the observation to the target class. Once the logistic regression function assigns a probability, this requires the model to be fit and trained on the dataset, an example further down, the data point is projected into a class based on the probability value. For probability values greater than 0.5 the value is projected onto 1, for us the target class, and for probability values less than 0.5, they are projected onto the 0 class, or not the target class.
A standard sigmoid function looks as follows:
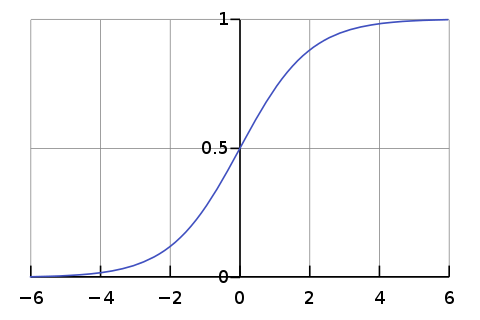 Standard logistic function | Photo source Wikipedia.)
This transforms our original dataset regression line into:
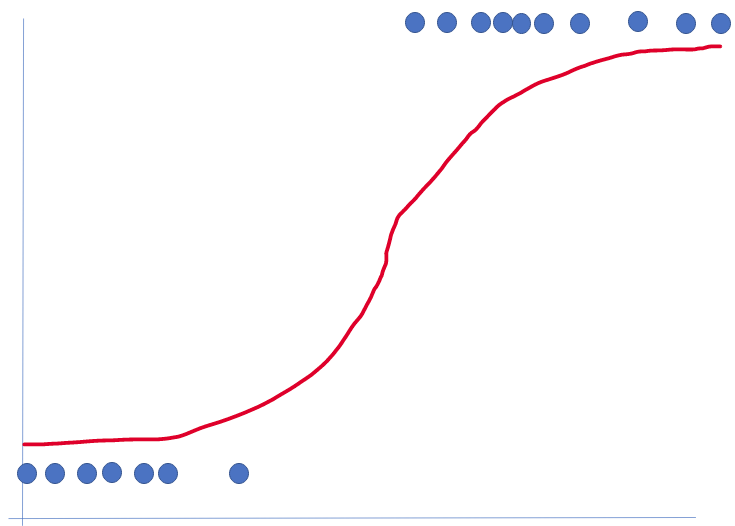 The inflection point is at 0.5
What just happened?
This "s" shape is a powerful tool for classification purposes. I like to think that given probability value output for a given observation, say 0.36, that the logistic regression is "squishing" the probability down to binary value. Interpreting this, the model is saying that there is only a 36% chance that the given observation belongs to the target class the model was trained on - let us say that is 1. Meaning that there is a 1 - .36 or 64% chance that this observation does not belong to the target class, so it is labeled as 0 ->the observation is projected down to the dependent variable outcome label of 0.
The logistic regression line is similar to our previous regression examples, but we interpret the output as a probability of assigning the data point to the target class.
The most common flavor of logistic regression is binary logistic regression, but multinomial logit models do exist for multiclass regression analysis.
N.B: It is technically possible to achieve a value of 0.5, but vanishingly small. Regardless, the algorithm you are using will have some predefined instruction on how to classify this edge case.
Python example: Logistic regression
For illustrative purposes, I will be using the famous iris dataset included with sklean to demonstrate the classification power in the following Jupyter notebook cells:
text
import numpy as np
import pandas as pd
import matplotlib.pyplot as plt
import seaborn as sns
from sklearn.model_selection import train_test_split
from sklearn.preprocessing import StandardScaler
from sklearn.metrics import accuracy_score
text
%matplotlib inline
Create a df and transform all the raw data into a format familiar to sklearn:
text
from sklearn.datasets import load_iris
iris = load_iris()
df = pd.DataFrame(data= np.c_[iris['data'], iris['target']],
 columns= ["sepel_length_cm", "sepal_width_cm",
 "petal_length_cm", "petal_width_cm", "target"])
text
df.head()
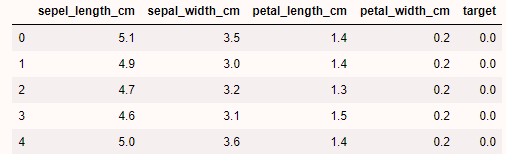 Data is well imported
text
df.describe()
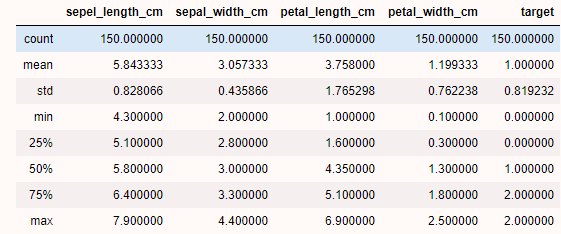 Basic summary statistics
The data set contains the true labels, and we can see how nice and separable the three classes are:
text
sns.pairplot(df, height=2.5, hue='target')
plt.show()
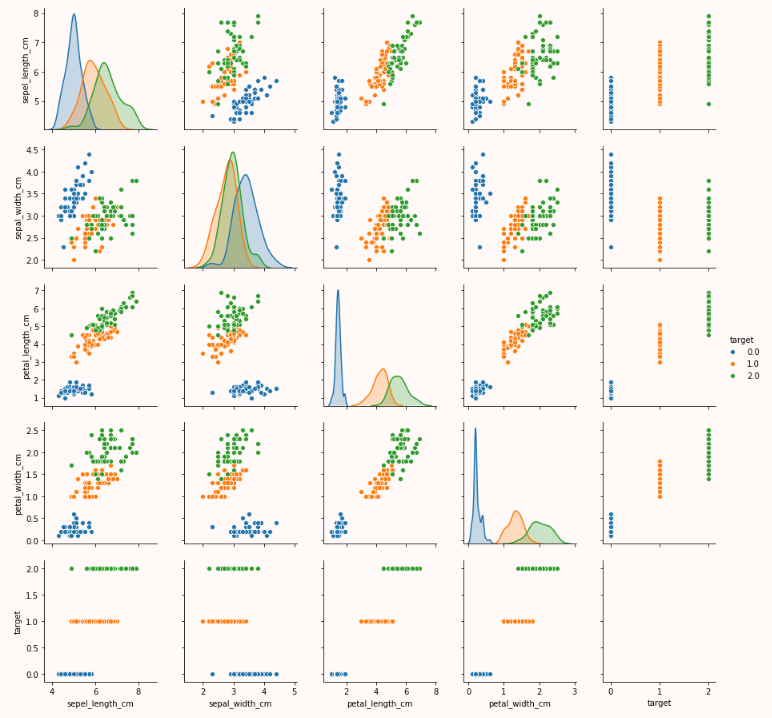 The classifications for the three flower types based on their measurables
text
df['target'].value_counts()
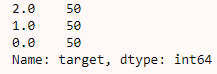 Note how we have three classes of flowers, each with 50 observations. This dataset is very well balanced.
text
X, y = load_iris(return_X_y=True)
text
X[:5]
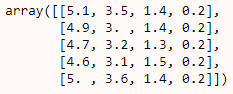 text
y[:5]
 The above five flowers are all of the 0 class.
text
from sklearn.linear_model import LogisticRegression
text
# instantiate the model and fit
log = LogisticRegression(multi_class='warn', solver='warn')
log_reg = log.fit(X, y)
text
log_reg
 text
# score the model
log.score(X, y)
 As we can see, this is a very good score for the model!
Next, I will talk about Time Series Analysis!
Find me on Linkedin
Physicist cum Data Scientist- Available for new opportunity | SaaS | Sports | Start-ups | Scale-ups
Register Now to Continue Reading
Unlock Towards Data Science with a Free Account
All articles on Towards Data Science are available to registered users. Create a free account today to access this article and thousands more.
Register for freeSign in to your account
 Written By
See all from James Andrew Godwin
Data ScienceLogistic RegressionMachine LearningPythonTowards Data Science
Share This Article
Towards Data Science is a community publication. Submit your insights to reach our global audience and earn through the TDS Author Payment Program.
Write for TDS
Related Articles
Programming
New data is created every single second - a ton of it. This data comes from your smartphone that tracks your movements, your web browser...
Steve Sangapu
July 10, 20208 min read
Data Science
Deploying a FastAPI + PostgreSQL recommender system as a web application on Render
Lucas See
September 25, 202515 min read
Data Science
How to make API calls to your Alteryx workflows from UiPath
Deepak Krishnamurthy
April 3, 20223 min read
Artificial Intelligence
Deploying Sentiment Analysis with Python and AI to analyze the Earnings Call of Companies
Bharath K
February 23, 202210 min read
Data Science
The burden of poverty in Kansas City goes deeper than income and housing
Scott Haluck
December 23, 20204 min read
Artificial Intelligence
Train, visualize, evaluate, interpret, and deploy models with minimal code.
Amol Mavuduru
February 25, 202110 min read
Data Science
This series was written together with Ibukun Aribilola and Valdrin Jonuzi as part of the Data Science for Social Good tutorial.
Ang Li-Lian
April 22, 202210 min read
Machine Learning
Many Data Scientists focuses on algorithms and mathematics but fail to learn an important skill - communication.
Roman Orac
November 19, 20206 min read
Machine Learning
Learn how to build an MLOps pipeline with Azure API management to deploy models as secure endpoints
René Bremer
October 31, 20215 min read
Your home for data science and AI. The world's leading publication for data science, data analytics, data engineering, machine learning, and artificial intelligence professionals.
Subscribe to Our NewsletterWrite For TDS•About•Advertise•Privacy Policy•Terms of Use
© Insight Media Group, LLC 2026•The New Stack•roadmap.sh•Creator Network
Recommended Articles
Close