保留正文与补采附件。源页面当前未重新核验;具体限制见交付清单。
 We value your privacy
We use cookies to enhance your browsing experience, serve personalised ads or content, and analyse our traffic. By clicking "Accept All", you consent to our use of cookies.
Customise Reject All Accept All
Customise Consent Preferences
 We use cookies to help you navigate efficiently and perform certain functions. You will find detailed information about all cookies under each consent category below.
The cookies that are categorised as "Necessary" are stored on your browser as they are essential for enabling the basic functionalities of the site. ... Show more
NecessaryAlways Active
Necessary cookies are required to enable the basic features of this site, such as providing secure log-in or adjusting your consent preferences. These cookies do not store any personally identifiable data.
-
Cookie
BCTempID
-
Duration
10 minutes
-
Description
No description available.
-
Cookie
__cf_bm
-
Duration
1 hour
-
Description
This cookie, set by Cloudflare, is used to support Cloudflare Bot Management.
-
Cookie
AWSALBCORS
-
Duration
7 days
-
Description
Amazon Web Services set this cookie for load balancing.
-
Cookie
_cfuvid
-
Duration
session
-
Description
Cloudflare sets this cookie to track users across sessions to optimize user experience by maintaining session consistency and providing personalized services
-
Cookie
li_gc
-
Duration
6 months
-
Description
Linkedin set this cookie for storing visitor's consent regarding using cookies for non-essential purposes.
-
Cookie
__hssrc
-
Duration
session
-
Description
This cookie is set by Hubspot whenever it changes the session cookie. The __hssrc cookie set to 1 indicates that the user has restarted the browser, and if the cookie does not exist, it is assumed to be a new session.
-
Cookie
__hssc
-
Duration
1 hour
-
Description
HubSpot sets this cookie to keep track of sessions and to determine if HubSpot should increment the session number and timestamps in the __hstc cookie.
-
Cookie
wpEmojiSettingsSupports
-
Duration
session
-
Description
WordPress sets this cookie when a user interacts with emojis on a WordPress site. It helps determine if the user's browser can display emojis properly.
-
Cookie
BCSessionID
-
Duration
1 year 1 month 4 days
-
Description
Blueconic sets this cookie as a unique identifier for the BlueConic profile.
-
Cookie
_octo
-
Duration
1 year
-
Description
No description available.
-
Cookie
logged_in
-
Duration
1 year
-
Description
No description available.
-
Cookie
__Secure-YEC
-
Duration
past
-
Description
YouTube sets this cookie to stores the user's video player preferences using embedded YouTube video
-
Cookie
__eoi
-
Duration
6 months
-
Description
Description is currently not available.
-
Cookie
AWSALBTGCORS
-
Duration
7 days
-
Description
No description available.
-
Cookie
login-status-p
-
Duration
past
-
Description
Description is currently not available.
-
Cookie
AWSALBTG
-
Duration
7 days
-
Description
No description available.
-
Cookie
csrf_token
-
Duration
session
-
Description
No description available.
-
Cookie
token_v2
-
Duration
1 day
-
Description
Description is currently not available.
-
Cookie
D
-
Duration
1 year
-
Description
Description is currently not available.
-
Cookie
PHPSESSID
-
Duration
session
-
Description
This cookie is native to PHP applications. The cookie stores and identifies a user's unique session ID to manage user sessions on the website. The cookie is a session cookie and will be deleted when all the browser windows are closed.
-
Cookie
VISITOR_PRIVACY_METADATA
-
Duration
6 months
-
Description
YouTube sets this cookie to store the user's cookie consent state for the current domain.
-
Cookie
cookietest
-
Duration
session
-
Description
The cookietest cookie is typically used to determine whether the user's browser accepts cookies, essential for website functionality and user experience.
-
Cookie
__Host-airtable-session
-
Duration
1 year
-
Description
This cookie is used to enable us to integrate the services of Airtable.
-
Cookie
__Host-airtable-session.sig
-
Duration
1 year
-
Description
This cookie is used to enable us to integrate the services of Airtable.
-
Cookie
m
-
Duration
1 year 1 month 4 days
-
Description
Stripe sets this cookie for fraud prevention purposes. It identifies the device used to access the website, allowing the website to be formatted accordingly.
-
Cookie
BIGipServer*
-
Duration
session
-
Description
Marketo sets this cookie to collect information about the user's online activity and build a profile about their interests to provide advertisements relevant to the user.
-
Cookie
__cfruid
-
Duration
session
-
Description
Cloudflare sets this cookie to identify trusted web traffic.
-
Cookie
_GRECAPTCHA
-
Duration
6 months
-
Description
Google Recaptcha service sets this cookie to identify bots to protect the website against malicious spam attacks.
-
Cookie
__Secure-YNID
-
Duration
6 months
-
Description
Google cookie used to protect user security and prevent fraud, especially during the login process.
-
Cookie
cookieyes-consent
-
Duration
1 year
-
Description
CookieYes sets this cookie to remember users' consent preferences so that their preferences are respected on subsequent visits to this site. It does not collect or store any personal information about the site visitors.
Functional
Functional cookies help perform certain functionalities like sharing the content of the website on social media platforms, collecting feedback, and other third-party features.
-
Cookie
lidc
-
Duration
1 day
-
Description
LinkedIn sets the lidc cookie to facilitate data center selection.
-
Cookie
brw
-
Duration
1 year
-
Description
No description available.
-
Cookie
brwConsent
-
Duration
5 minutes
-
Description
Description is currently not available.
-
Cookie
WMF-Uniq
-
Duration
1 year
-
Description
Description is currently not available.
-
Cookie
loom_anon_comment
-
Duration
1 year
-
Description
No description available.
-
Cookie
loom_referral_video
-
Duration
session
-
Description
Description is currently not available.
-
Cookie
VISITOR_INFO1_LIVE
-
Duration
6 months
-
Description
A cookie set by YouTube to measure bandwidth that determines whether the user gets the new or old player interface.
-
Cookie
yt-remote-connected-devices
-
Duration
Never Expires
-
Description
YouTube sets this cookie to store the user's video preferences using embedded YouTube videos.
-
Cookie
ytidb::LAST_RESULT_ENTRY_KEY
-
Duration
Never Expires
-
Description
The cookie ytidb::LAST_RESULT_ENTRY_KEY is used by YouTube to store the last search result entry that was clicked by the user. This information is used to improve the user experience by providing more relevant search results in the future.
-
Cookie
yt-remote-device-id
-
Duration
Never Expires
-
Description
YouTube sets this cookie to store the user's video preferences using embedded YouTube videos.
-
Cookie
yt-remote-session-name
-
Duration
session
-
Description
The yt-remote-session-name cookie is used by YouTube to store the user's video player preferences using embedded YouTube video.
-
Cookie
yt-remote-fast-check-period
-
Duration
session
-
Description
The yt-remote-fast-check-period cookie is used by YouTube to store the user's video player preferences for embedded YouTube videos.
-
Cookie
yt-remote-session-app
-
Duration
session
-
Description
The yt-remote-session-app cookie is used by YouTube to store user preferences and information about the interface of the embedded YouTube video player.
-
Cookie
yt-remote-cast-available
-
Duration
session
-
Description
The yt-remote-cast-available cookie is used to store the user's preferences regarding whether casting is available on their YouTube video player.
-
Cookie
yt-remote-cast-installed
-
Duration
session
-
Description
The yt-remote-cast-installed cookie is used to store the user's video player preferences using embedded YouTube video.
-
Cookie
cp_session
-
Duration
3 months
-
Description
Codepen sets this cookie for Help systems found in the website.
-
Cookie
loid
-
Duration
1 year 1 month 4 days
-
Description
This cookie is set by the Reddit. The cookie enables the sharing of content from the website onto the social media platform.
Analytics
Analytical cookies are used to understand how visitors interact with the website. These cookies help provide information on metrics such as the number of visitors, bounce rate, traffic source, etc.
-
Cookie
__hstc
-
Duration
6 months
-
Description
Hubspot set this main cookie for tracking visitors. It contains the domain, initial timestamp (first visit), last timestamp (last visit), current timestamp (this visit), and session number (increments for each subsequent session).
-
Cookie
hubspotutk
-
Duration
6 months
-
Description
HubSpot sets this cookie to keep track of the visitors to the website. This cookie is passed to HubSpot on form submission and used when deduplicating contacts.
-
Cookie
_ga
-
Duration
1 year 1 month 4 days
-
Description
Google Analytics sets this cookie to calculate visitor, session and campaign data and track site usage for the site's analytics report. The cookie stores information anonymously and assigns a randomly generated number to recognise unique visitors.
-
Cookie
ga*
-
Duration
1 year 1 month 4 days
-
Description
Google Analytics sets this cookie to store and count page views.
-
Cookie
__Host-psifi.analyticsTrace
-
Duration
6 hours
-
Description
Description is currently not available.
-
Cookie
__Host-psifi.analyticsTraceV2
-
Duration
6 hours
-
Description
Description is currently not available.
-
Cookie
_gh_sess
-
Duration
session
-
Description
GitHub sets this cookie for temporary application and framework state between pages like what step the user is on in a multiple step form.
-
Cookie
YSC
-
Duration
session
-
Description
YSC cookie is set by Youtube and is used to track the views of embedded videos on Youtube pages.
-
Cookie
ajs_anonymous_id
-
Duration
1 year
-
Description
This cookie is set by Segment to count the number of people who visit a certain site by tracking if they have visited before.
-
Cookie
vuid
-
Duration
1 year 1 month 4 days
-
Description
Vimeo installs this cookie to collect tracking information by setting a unique ID to embed videos on the website.
Performance
Performance cookies are used to understand and analyse the key performance indexes of the website which helps in delivering a better user experience for the visitors.
-
Cookie
AWSALB
-
Duration
7 days
-
Description
AWSALB is an application load balancer cookie set by Amazon Web Services to map the session to the target.
-
Cookie
acq
-
Duration
past
-
Description
Description is currently not available.
-
Cookie
acq.sig
-
Duration
past
-
Description
Description is currently not available.
-
Cookie
ptc
-
Duration
2 years
-
Description
No description available.
Advertisement
Advertisement cookies are used to provide visitors with customised advertisements based on the pages you visited previously and to analyse the effectiveness of the ad campaigns.
-
Cookie
muc_ads
-
Duration
1 year 1 month 4 days
-
Description
Twitter sets this cookie to collect user behaviour and interaction data to optimize the website.
-
Cookie
guest_id_marketing
-
Duration
1 year 1 month 4 days
-
Description
Twitter sets this cookie to identify and track the website visitor.
-
Cookie
guest_id_ads
-
Duration
1 year 1 month 4 days
-
Description
Twitter sets this cookie to identify and track the website visitor.
-
Cookie
personalization_id
-
Duration
1 year 1 month 4 days
-
Description
Twitter sets this cookie to integrate and share features for social media and also store information about how the user uses the website, for tracking and targeting.
-
Cookie
guest_id
-
Duration
1 year 1 month 4 days
-
Description
Twitter sets this cookie to identify and track the website visitor. It registers if a user is signed in to the Twitter platform and collects information about ad preferences.
-
Cookie
bcookie
-
Duration
1 year
-
Description
LinkedIn sets this cookie from LinkedIn share buttons and ad tags to recognize browser IDs.
-
Cookie
__Secure-ROLLOUT_TOKEN
-
Duration
6 months
-
Description
YouTube sets this cookie to manage feature rollout and experimentation. It helps Google control which new features or interface changes are shown to users as part of testing and staged rollouts, ensuring consistent experience for a given user during an experiment.
-
Cookie
yt.innertube::nextId
-
Duration
Never Expires
-
Description
YouTube sets this cookie to register a unique ID to store data on what videos from YouTube the user has seen.
-
Cookie
yt.innertube::requests
-
Duration
Never Expires
-
Description
YouTube sets this cookie to register a unique ID to store data on what videos from YouTube the user has seen.
-
Cookie
session_tracker
-
Duration
session
-
Description
This cookie is set by the Reddit. This cookie is used to identify trusted web traffic. It also helps in adverstising on the website.
-
Cookie
edgebucket
-
Duration
session
-
Description
Reddit sets this cookie to save the information about a log-on Reddit user, for the purpose of advertisement recommendations and updating the content.
-
Cookie
did
-
Duration
1 year
-
Description
Arbor sets this cookie to show targeted ads to site visitors.This cookie expires after 2 months or 1 year.
Uncategorised
Other uncategorised cookies are those that are being analysed and have not been classified into a category as yet.
No cookies to display.
Reject All Save My Preferences Accept All
Toggle SearchToggle Mobile Navigation
Publish AI, ML & data-science insights to a global community of data professionals.
Sign inSubmit an Article
LatestEditor's PicksNewsletterShipAI
Write For TDS
LinkedInXToggle Search
Data Science
Customer Satisfaction Measurement with N-gram and Sentiment Analysis
Product reviews are an excellent source of information for qualified management decisions. Learn more about the right text mining...
Petr Koráb
April 10, 20237 min read
Product reviews are an excellent source of information for qualified management decisions. Learn more about the right text mining techniques.
 Photo by Freepik on Freepik
Learn this step by step with the interactive AI and Data Scientist roadmap.
Introduction
Happy customers drive company growth. The five-word sentence explains everything about why we do our best to maximize customer satisfaction. Product reviews are one of the major data sources that large companies like Amazon and Apple, middle-sized exporters including Lentiamo, and local companies running their Facebook pages collect. Reviews are typically collected repeatedly over time, and factors like quality shifts, marketing communications, and customer care friendliness impact the sentiment expressed by customers.
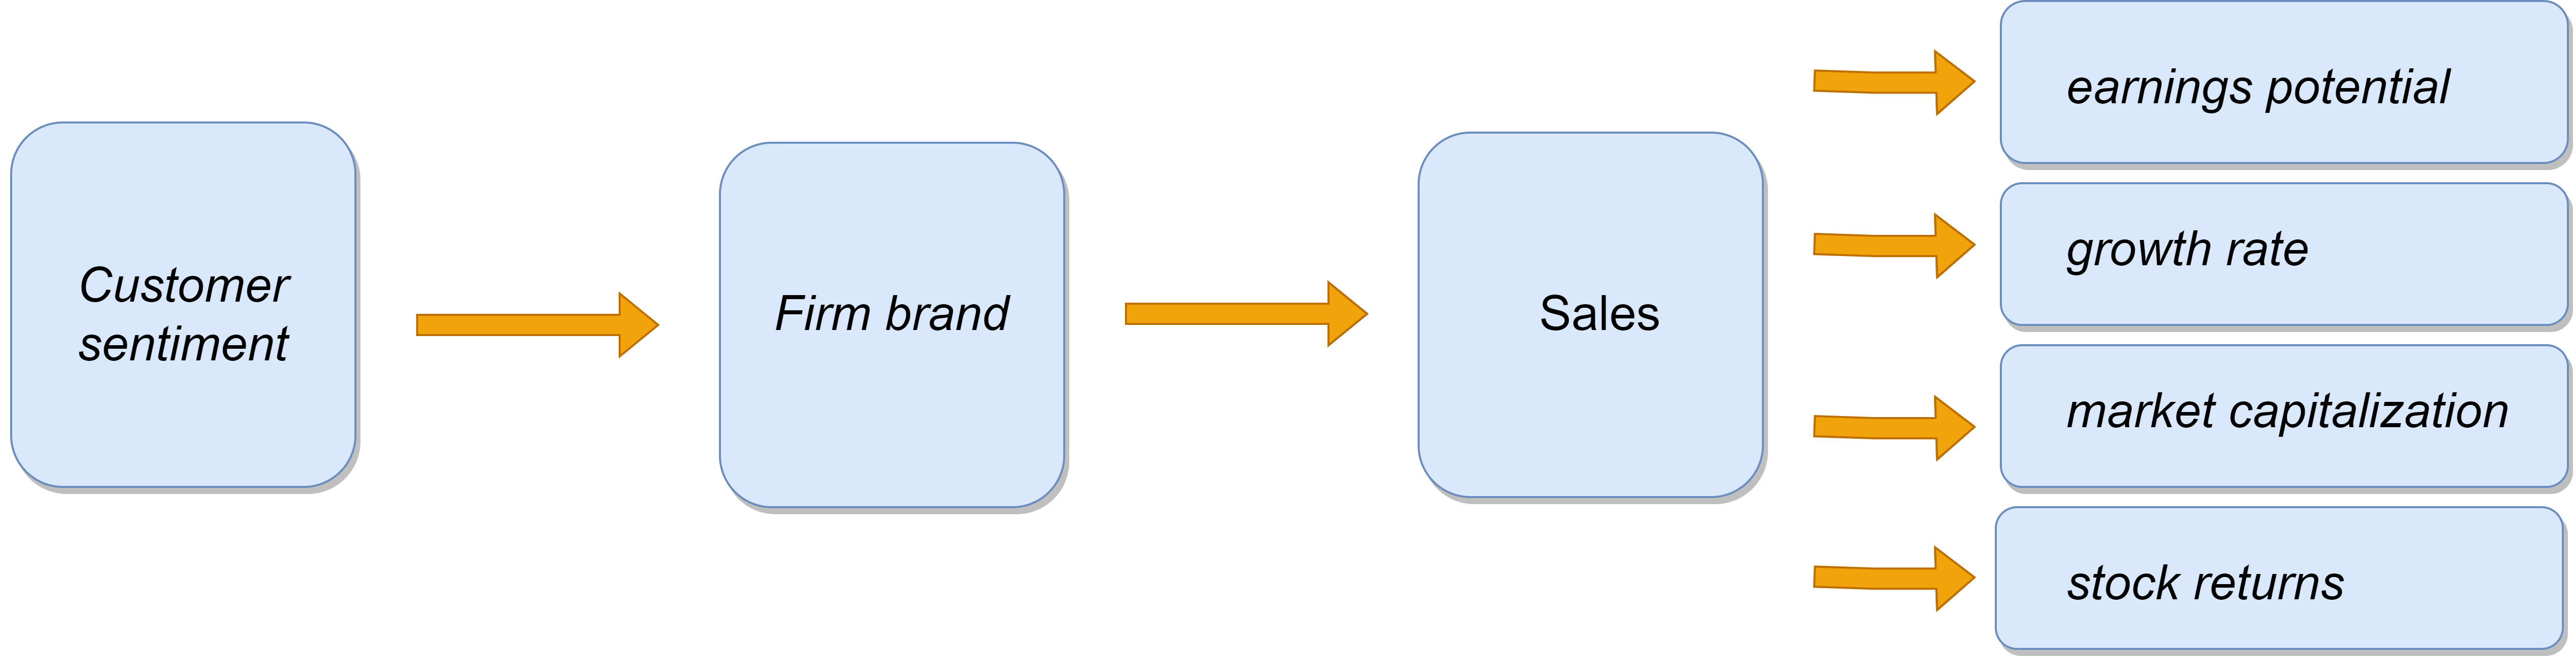 Note: Image by author, based on the review of Karim (2011), Baker and Wurgler (2006), Merrin et al. (2013), and Eachempat et al. (2022)
The Business Intelligence (BI) role should be to analyze product reviews, identify potential problems, and develop hypotheses to solve them. In the next stage, these recommendations are scrutinized by other departments based on the company structure. This article will explain more closely the analytics of customer satisfaction measurement with product reviews data.
The-end-to end process includes:
- How to make an exploratory analysis of time-series product reviews
- How to quickly evaluate sentiment in product reviews over time
- How to display the most frequent satisfaction factors over time
We'll work in Python, which most BI and data analysts routinely use.
2. Data
Getting unscraped product reviews data with a flexible data license is generally difficult. Synthetic data from Fake Reviews Dataset distributed with Attribution 4.0 International license is an excellent option in this case.
The data looks like this:
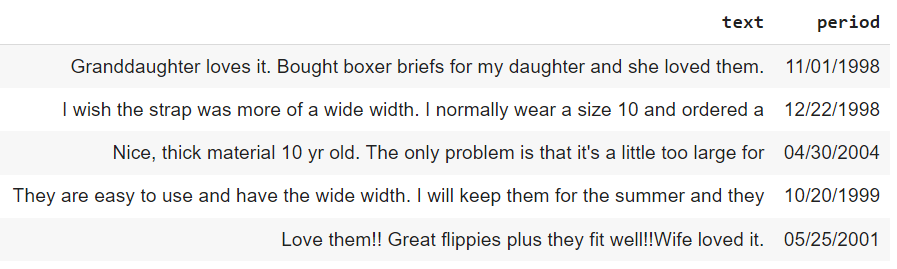 Image 1. Fake Reviews Dataset
The text column contains product reviews, and period marks the review date. The subset we'll work with contains 3848 reviews of clothing, shoes, and jewelry products.
3. Exploratory data analysis (EDA)
EDA in this type of dataset should discover the completeness of the dataset for each period of interest and the presence of noise that does not bring valuable information – digits and special characters. We try to avoid the situation of highly imbalanced datasets containing very few reviews in some periods and noisy datasets with too many digits and special characters (/, @, &,;, ? etc.).
3.1. Checking for data completeness
First, let's check the data for completeness for each period. We make annual comparisons and therefore summarise the reviews for each year:
python
import pandas as pd

# Calculate review frequencies by year
data['year'] = pd.DatetimeIndex(data['period']).year
rows_count = data.groupby('year', as_index=False).year.value_counts()
rows_count.columns=['year','reviews']

import matplotlib.pyplot as plt

# Generate a line plot
rows_count.plot.line(x='year',y = 'reviews')
plt.show()
A simple line pot shows the yearly review frequencies. It is not necessary to make any graph formatting here:
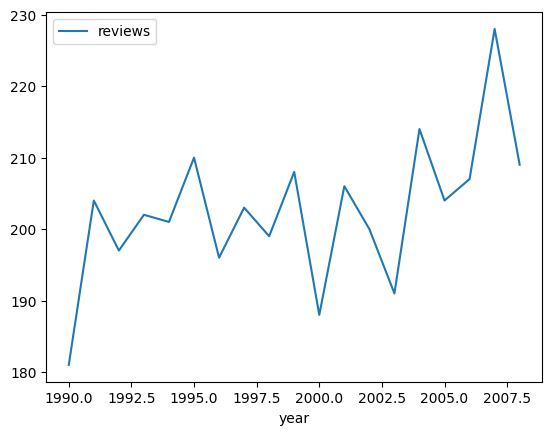 Image 2. Yearly product review frequencies. Image by author.
The dataset is not largely imbalanced. We have about 200 and more reviews per year, which makes a solid dataset for sentient and n-gram analyses.
3.2. Calculating letter-to-other characters ratio
Next, let's check if the data does not consist mainly of numbers and special characters, which could bias later text mining procedures.
python
import re

# Convert product reviews to a string
text = pd.Series.to_string(data['text'], index = False)

# Remove newline characters
text = re.sub('n', '', text)

# Calculate sum of numbers, letters, and spaces
numbers = sum(c.isdigit() for c in text)
letters = sum(c.isalpha() for c in text)
spaces  = sum(c.isspace() for c in text)
others  = len(text) - numbers - letters - spaces
We calculate cleanness and dirtiness (the opposite) metrics that show the ratios of letters to other characters (numbers, spaces, and special characters):
python
# Calculate metrics
dirtiness = ((numbers + others) / len(text)) * 100
cleanness = ((letters + spaces) / len(text)) * 100

print(dirtiness)
print(cleanness)
The print output is:
- dirtiness is 8.77 %
- cleanness is 91.22 %
We have around 9 % of digits and special characters in the data. This volume of noise should not bias sentiment analysis in the later stage.
4. Customer satisfaction measurement
Text mining attempts to find out: (1) how the customers' sentiment developed over time and (2) which factors contributed to changes in customer satisfaction. We'll use Arabica, a Python library for time-series text mining, to explore both.
EDIT Jul 2023 : Arabica has been updated. Check the documentation for the full list of parameters.
4.1. Sentiment analysis
Arabica offers coffee_break module for sentiment and breakpoint analysis. Its documentation provides more details about the models and methodology of sentiment evaluation.
This code cleans data from punctuation and numbers, removes other redundant strings ("
", "/n", and "Another Long String" are used as examples), calculates sentiment for each review, aggregates the sentiment by year, and identifies two major break points in the sentiment time series:
python
from arabica import coffee_break

coffee_break(text = data['text'],
             time = data['period'],
             date_format = 'us',     # Use US-style date format to read dates
             preprocess = True,      # Clean data - digits and punctuation
             skip = ['<br />',       # Remove additional stop words
                     '/n',
             'Another Long String'],
             n_breaks = 2,           # 2 breakpoints identified
             time_freq = 'Y')        # Yearly aggregation
The line plot with sentiment and breakpoints:
 Image 3. Sentiment analysis with breakpoints. Image by author.
We can see fluctuations in sentiment over time. These changes are not rapid as sentiment varies [0.6: 0.7]. The higher value of sentiment, the better customers perceive the products (and the opposite).
In 1991 and 2000, there were positive and negative breakpoints in sentiment. In the next stage, let's check what caused these shifts.
4.2. Factors driving customer satisfaction
We'll use a heatmap of n-gram-frequencies from the cappuccino module to visually derive the factors that influenced customers' sentiment. Read the documentation for more technical details.
This code plots a heatmap of the eight most frequent bigrams (i.e., two consecutive words) in each year. The data pre-processing includes cleaning from English stopwords, numbers, and three unwanted strings ("
", "/n" , and "Another Long String"). Punctuation and blank rows are removed automatically:
python
from arabica import cappuccino

cappuccino(text = data['text'],
           time = data['period'],
           date_format = 'us',       # Use US-style date format to parse dates
           plot = 'heatmap',
           ngram = 2,                # N-gram size, 1 = unigram, 2 = bigram
           time_freq = 'Y',          # Aggregation period, 'M' = monthly, 'Y' = yearly
           max_words = 8,            # Display 8 most frequent bigrams for each period
           stopwords = ['english'],  # Remove English stopwords
           skip = ['<br />',         # Remove additional stop words
                   '/n',
           'Another Long String'],
           numbers = True,           # Remove numbers
           lower_case = True)        # Lowercase text
The bigram heatmap:
 Image 4. Bigram heatmap. Image by author.
Bigram frequencies indicate that:
- 2000s drop (missing "would recommend", "fits perfectly", and "fit perfect" in the top 8), and high frequencies of "wide foot" and "size fit" suggest that we might be selling products to people that do not fit their size of foot. Note that we removed stop words such as "don't".
Conclusions
This type of text-mining analytics should help make qualified data-informed decisions and improve the quality of our products and services. Based on the analytical results, we determine a set of hypotheses about what might be wrong and where is space for improvement.
From the text mining analysis in this article, we can see potential problems with product quality. The products fit worse our customers' current needs. Receiving the reviews in 2001, the analysts should formulate a set of problem hypotheses such as:
- The new shoes don't fit well.
- We don't sell wide-foot shoes, but customers demand them.
- There's a quality problem in the production of new products.
Many other potential problem hypotheses arise since you know your products better than anyone else. Other departments (Marketing, Customer Care, Logistics, ..) should find out where the problem is, then react with specific improvements, and fix the problem. The response, of course, depends on the company's size and structure and other firm-specific factors.
The jupyter notebook with the code and data is on my GitHub.
Did you like the article? You can invite me for coffee and support my writing. You can also subscribe to my email list to get notified about my new articles. Thanks!
References
Baker, M., Wurgler, J., 2006. Investor sentiment and the cross-section of stock returns. Journal of Finance 61 (4).
Eachempati, P., Srivastava, P. R., Kumar A., Munoz, J., Dursun D., 2022. Can customer sentiment impact firm value? An integrated text mining approach. Technological Forecasting & Social Change 174 (1).
Karim, B., 2011. Corporate name change and shareholder wealth effect: empirical evidence in the French stock market. Journal of Asset Management 12 (3).
Merrin, R. P., Hoffmann, A. O., Pennings, J. M., 2013. Customer satisfaction as a buffer against sentimental stock-price corrections. Marketing Letters 24 (1).
Register Now to Continue Reading
Unlock Towards Data Science with a Free Account
All articles on Towards Data Science are available to registered users. Create a free account today to access this article and thousands more.
Register for freeSign in to your account
 Written By
See all from Petr Koráb
Business IntelligenceData SciencePythonSentiment AnalysisText Mining
Share This Article
Towards Data Science is a community publication. Submit your insights to reach our global audience and earn through the TDS Author Payment Program.
Write for TDS
Related Articles
Artificial Intelligence
Don't just train, but also deploy: a step-by-step guide
Avi Chawla
September 10, 20228 min read
Artificial Intelligence
Four lessons from launching my first product
Cameron Afzal
September 10, 20209 min read
Artificial Intelligence
A practical tutorial
Soner Yıldırım
March 18, 20214 min read
Programming
Plotly dash apps are the fastest way to build production-grade dashboards in python.
Thuwarakesh Murallie
September 5, 20216 min read
Data Science
Today I extracted Google Trends data using R to find cities with most searches in 'Data Visualization' and 'Data science' as well as...
Hannah Yan Han
September 9, 20173 min read
Beginners Guide to Geospatial Data Plotting
Ryan Lewis
March 14, 20215 min read
Data Science
A guide with free resources for building your skills
Brian Perron, PhD
June 9, 20225 min read
Programming
Your data is good - but you can make it better.
Benjamin Nweke
May 18, 20226 min read
Programming
Advice from a Data Scientist in the same position
Terence Shin, MSc, MBA
October 29, 20207 min read
Your home for data science and AI. The world's leading publication for data science, data analytics, data engineering, machine learning, and artificial intelligence professionals.
Subscribe to Our NewsletterWrite For TDS•About•Advertise•Privacy Policy•Terms of Use
© Insight Media Group, LLC 2026•The New Stack•roadmap.sh•Creator Network
Recommended Articles
Close