保留正文与补采附件。源页面当前未重新核验;具体限制见交付清单。
 We value your privacy
We use cookies to enhance your browsing experience, serve personalised ads or content, and analyse our traffic. By clicking "Accept All", you consent to our use of cookies.
Customise Reject All Accept All
Customise Consent Preferences
 We use cookies to help you navigate efficiently and perform certain functions. You will find detailed information about all cookies under each consent category below.
The cookies that are categorised as "Necessary" are stored on your browser as they are essential for enabling the basic functionalities of the site. ... Show more
NecessaryAlways Active
Necessary cookies are required to enable the basic features of this site, such as providing secure log-in or adjusting your consent preferences. These cookies do not store any personally identifiable data.
-
Cookie
BCTempID
-
Duration
10 minutes
-
Description
No description available.
-
Cookie
__cf_bm
-
Duration
1 hour
-
Description
This cookie, set by Cloudflare, is used to support Cloudflare Bot Management.
-
Cookie
AWSALBCORS
-
Duration
7 days
-
Description
Amazon Web Services set this cookie for load balancing.
-
Cookie
_cfuvid
-
Duration
session
-
Description
Cloudflare sets this cookie to track users across sessions to optimize user experience by maintaining session consistency and providing personalized services
-
Cookie
li_gc
-
Duration
6 months
-
Description
Linkedin set this cookie for storing visitor's consent regarding using cookies for non-essential purposes.
-
Cookie
__hssrc
-
Duration
session
-
Description
This cookie is set by Hubspot whenever it changes the session cookie. The __hssrc cookie set to 1 indicates that the user has restarted the browser, and if the cookie does not exist, it is assumed to be a new session.
-
Cookie
__hssc
-
Duration
1 hour
-
Description
HubSpot sets this cookie to keep track of sessions and to determine if HubSpot should increment the session number and timestamps in the __hstc cookie.
-
Cookie
wpEmojiSettingsSupports
-
Duration
session
-
Description
WordPress sets this cookie when a user interacts with emojis on a WordPress site. It helps determine if the user's browser can display emojis properly.
-
Cookie
BCSessionID
-
Duration
1 year 1 month 4 days
-
Description
Blueconic sets this cookie as a unique identifier for the BlueConic profile.
-
Cookie
_octo
-
Duration
1 year
-
Description
No description available.
-
Cookie
logged_in
-
Duration
1 year
-
Description
No description available.
-
Cookie
__Secure-YEC
-
Duration
past
-
Description
YouTube sets this cookie to stores the user's video player preferences using embedded YouTube video
-
Cookie
__eoi
-
Duration
6 months
-
Description
Description is currently not available.
-
Cookie
AWSALBTGCORS
-
Duration
7 days
-
Description
No description available.
-
Cookie
login-status-p
-
Duration
past
-
Description
Description is currently not available.
-
Cookie
AWSALBTG
-
Duration
7 days
-
Description
No description available.
-
Cookie
csrf_token
-
Duration
session
-
Description
No description available.
-
Cookie
token_v2
-
Duration
1 day
-
Description
Description is currently not available.
-
Cookie
D
-
Duration
1 year
-
Description
Description is currently not available.
-
Cookie
PHPSESSID
-
Duration
session
-
Description
This cookie is native to PHP applications. The cookie stores and identifies a user's unique session ID to manage user sessions on the website. The cookie is a session cookie and will be deleted when all the browser windows are closed.
-
Cookie
VISITOR_PRIVACY_METADATA
-
Duration
6 months
-
Description
YouTube sets this cookie to store the user's cookie consent state for the current domain.
-
Cookie
cookietest
-
Duration
session
-
Description
The cookietest cookie is typically used to determine whether the user's browser accepts cookies, essential for website functionality and user experience.
-
Cookie
__Host-airtable-session
-
Duration
1 year
-
Description
This cookie is used to enable us to integrate the services of Airtable.
-
Cookie
__Host-airtable-session.sig
-
Duration
1 year
-
Description
This cookie is used to enable us to integrate the services of Airtable.
-
Cookie
m
-
Duration
1 year 1 month 4 days
-
Description
Stripe sets this cookie for fraud prevention purposes. It identifies the device used to access the website, allowing the website to be formatted accordingly.
-
Cookie
BIGipServer*
-
Duration
session
-
Description
Marketo sets this cookie to collect information about the user's online activity and build a profile about their interests to provide advertisements relevant to the user.
-
Cookie
__cfruid
-
Duration
session
-
Description
Cloudflare sets this cookie to identify trusted web traffic.
-
Cookie
_GRECAPTCHA
-
Duration
6 months
-
Description
Google Recaptcha service sets this cookie to identify bots to protect the website against malicious spam attacks.
-
Cookie
__Secure-YNID
-
Duration
6 months
-
Description
Google cookie used to protect user security and prevent fraud, especially during the login process.
-
Cookie
cookieyes-consent
-
Duration
1 year
-
Description
CookieYes sets this cookie to remember users' consent preferences so that their preferences are respected on subsequent visits to this site. It does not collect or store any personal information about the site visitors.
Functional
Functional cookies help perform certain functionalities like sharing the content of the website on social media platforms, collecting feedback, and other third-party features.
-
Cookie
lidc
-
Duration
1 day
-
Description
LinkedIn sets the lidc cookie to facilitate data center selection.
-
Cookie
brw
-
Duration
1 year
-
Description
No description available.
-
Cookie
brwConsent
-
Duration
5 minutes
-
Description
Description is currently not available.
-
Cookie
WMF-Uniq
-
Duration
1 year
-
Description
Description is currently not available.
-
Cookie
loom_anon_comment
-
Duration
1 year
-
Description
No description available.
-
Cookie
loom_referral_video
-
Duration
session
-
Description
Description is currently not available.
-
Cookie
VISITOR_INFO1_LIVE
-
Duration
6 months
-
Description
A cookie set by YouTube to measure bandwidth that determines whether the user gets the new or old player interface.
-
Cookie
yt-remote-connected-devices
-
Duration
Never Expires
-
Description
YouTube sets this cookie to store the user's video preferences using embedded YouTube videos.
-
Cookie
ytidb::LAST_RESULT_ENTRY_KEY
-
Duration
Never Expires
-
Description
The cookie ytidb::LAST_RESULT_ENTRY_KEY is used by YouTube to store the last search result entry that was clicked by the user. This information is used to improve the user experience by providing more relevant search results in the future.
-
Cookie
yt-remote-device-id
-
Duration
Never Expires
-
Description
YouTube sets this cookie to store the user's video preferences using embedded YouTube videos.
-
Cookie
yt-remote-session-name
-
Duration
session
-
Description
The yt-remote-session-name cookie is used by YouTube to store the user's video player preferences using embedded YouTube video.
-
Cookie
yt-remote-fast-check-period
-
Duration
session
-
Description
The yt-remote-fast-check-period cookie is used by YouTube to store the user's video player preferences for embedded YouTube videos.
-
Cookie
yt-remote-session-app
-
Duration
session
-
Description
The yt-remote-session-app cookie is used by YouTube to store user preferences and information about the interface of the embedded YouTube video player.
-
Cookie
yt-remote-cast-available
-
Duration
session
-
Description
The yt-remote-cast-available cookie is used to store the user's preferences regarding whether casting is available on their YouTube video player.
-
Cookie
yt-remote-cast-installed
-
Duration
session
-
Description
The yt-remote-cast-installed cookie is used to store the user's video player preferences using embedded YouTube video.
-
Cookie
cp_session
-
Duration
3 months
-
Description
Codepen sets this cookie for Help systems found in the website.
-
Cookie
loid
-
Duration
1 year 1 month 4 days
-
Description
This cookie is set by the Reddit. The cookie enables the sharing of content from the website onto the social media platform.
Analytics
Analytical cookies are used to understand how visitors interact with the website. These cookies help provide information on metrics such as the number of visitors, bounce rate, traffic source, etc.
-
Cookie
__hstc
-
Duration
6 months
-
Description
Hubspot set this main cookie for tracking visitors. It contains the domain, initial timestamp (first visit), last timestamp (last visit), current timestamp (this visit), and session number (increments for each subsequent session).
-
Cookie
hubspotutk
-
Duration
6 months
-
Description
HubSpot sets this cookie to keep track of the visitors to the website. This cookie is passed to HubSpot on form submission and used when deduplicating contacts.
-
Cookie
_ga
-
Duration
1 year 1 month 4 days
-
Description
Google Analytics sets this cookie to calculate visitor, session and campaign data and track site usage for the site's analytics report. The cookie stores information anonymously and assigns a randomly generated number to recognise unique visitors.
-
Cookie
ga*
-
Duration
1 year 1 month 4 days
-
Description
Google Analytics sets this cookie to store and count page views.
-
Cookie
__Host-psifi.analyticsTrace
-
Duration
6 hours
-
Description
Description is currently not available.
-
Cookie
__Host-psifi.analyticsTraceV2
-
Duration
6 hours
-
Description
Description is currently not available.
-
Cookie
_gh_sess
-
Duration
session
-
Description
GitHub sets this cookie for temporary application and framework state between pages like what step the user is on in a multiple step form.
-
Cookie
YSC
-
Duration
session
-
Description
YSC cookie is set by Youtube and is used to track the views of embedded videos on Youtube pages.
-
Cookie
ajs_anonymous_id
-
Duration
1 year
-
Description
This cookie is set by Segment to count the number of people who visit a certain site by tracking if they have visited before.
-
Cookie
vuid
-
Duration
1 year 1 month 4 days
-
Description
Vimeo installs this cookie to collect tracking information by setting a unique ID to embed videos on the website.
Performance
Performance cookies are used to understand and analyse the key performance indexes of the website which helps in delivering a better user experience for the visitors.
-
Cookie
AWSALB
-
Duration
7 days
-
Description
AWSALB is an application load balancer cookie set by Amazon Web Services to map the session to the target.
-
Cookie
acq
-
Duration
past
-
Description
Description is currently not available.
-
Cookie
acq.sig
-
Duration
past
-
Description
Description is currently not available.
-
Cookie
ptc
-
Duration
2 years
-
Description
No description available.
Advertisement
Advertisement cookies are used to provide visitors with customised advertisements based on the pages you visited previously and to analyse the effectiveness of the ad campaigns.
-
Cookie
muc_ads
-
Duration
1 year 1 month 4 days
-
Description
Twitter sets this cookie to collect user behaviour and interaction data to optimize the website.
-
Cookie
guest_id_marketing
-
Duration
1 year 1 month 4 days
-
Description
Twitter sets this cookie to identify and track the website visitor.
-
Cookie
guest_id_ads
-
Duration
1 year 1 month 4 days
-
Description
Twitter sets this cookie to identify and track the website visitor.
-
Cookie
personalization_id
-
Duration
1 year 1 month 4 days
-
Description
Twitter sets this cookie to integrate and share features for social media and also store information about how the user uses the website, for tracking and targeting.
-
Cookie
guest_id
-
Duration
1 year 1 month 4 days
-
Description
Twitter sets this cookie to identify and track the website visitor. It registers if a user is signed in to the Twitter platform and collects information about ad preferences.
-
Cookie
bcookie
-
Duration
1 year
-
Description
LinkedIn sets this cookie from LinkedIn share buttons and ad tags to recognize browser IDs.
-
Cookie
__Secure-ROLLOUT_TOKEN
-
Duration
6 months
-
Description
YouTube sets this cookie to manage feature rollout and experimentation. It helps Google control which new features or interface changes are shown to users as part of testing and staged rollouts, ensuring consistent experience for a given user during an experiment.
-
Cookie
yt.innertube::nextId
-
Duration
Never Expires
-
Description
YouTube sets this cookie to register a unique ID to store data on what videos from YouTube the user has seen.
-
Cookie
yt.innertube::requests
-
Duration
Never Expires
-
Description
YouTube sets this cookie to register a unique ID to store data on what videos from YouTube the user has seen.
-
Cookie
session_tracker
-
Duration
session
-
Description
This cookie is set by the Reddit. This cookie is used to identify trusted web traffic. It also helps in adverstising on the website.
-
Cookie
edgebucket
-
Duration
session
-
Description
Reddit sets this cookie to save the information about a log-on Reddit user, for the purpose of advertisement recommendations and updating the content.
-
Cookie
did
-
Duration
1 year
-
Description
Arbor sets this cookie to show targeted ads to site visitors.This cookie expires after 2 months or 1 year.
Uncategorised
Other uncategorised cookies are those that are being analysed and have not been classified into a category as yet.
No cookies to display.
Reject All Save My Preferences Accept All
Toggle SearchToggle Mobile Navigation
Publish AI, ML & data-science insights to a global community of data professionals.
Sign inSubmit an Article
LatestEditor's PicksNewsletterShipAI
Write For TDS
LinkedInXToggle Search
Data Science
Is your model overfitting? Or maybe underfitting? An example using a neural network in python
Overfitting, underfitting, generalization ability, cross-validation. Everything simply explained. I also provide a python example using a...
Serafeim Loukas, PhD
June 24, 20207 min read
Is your model overfitting? Or maybe underfitting? An example using a neural network
Overfitting, underfitting, generalization ability, cross-validation. Everything simply explained. I also provide a python example using a neural network.
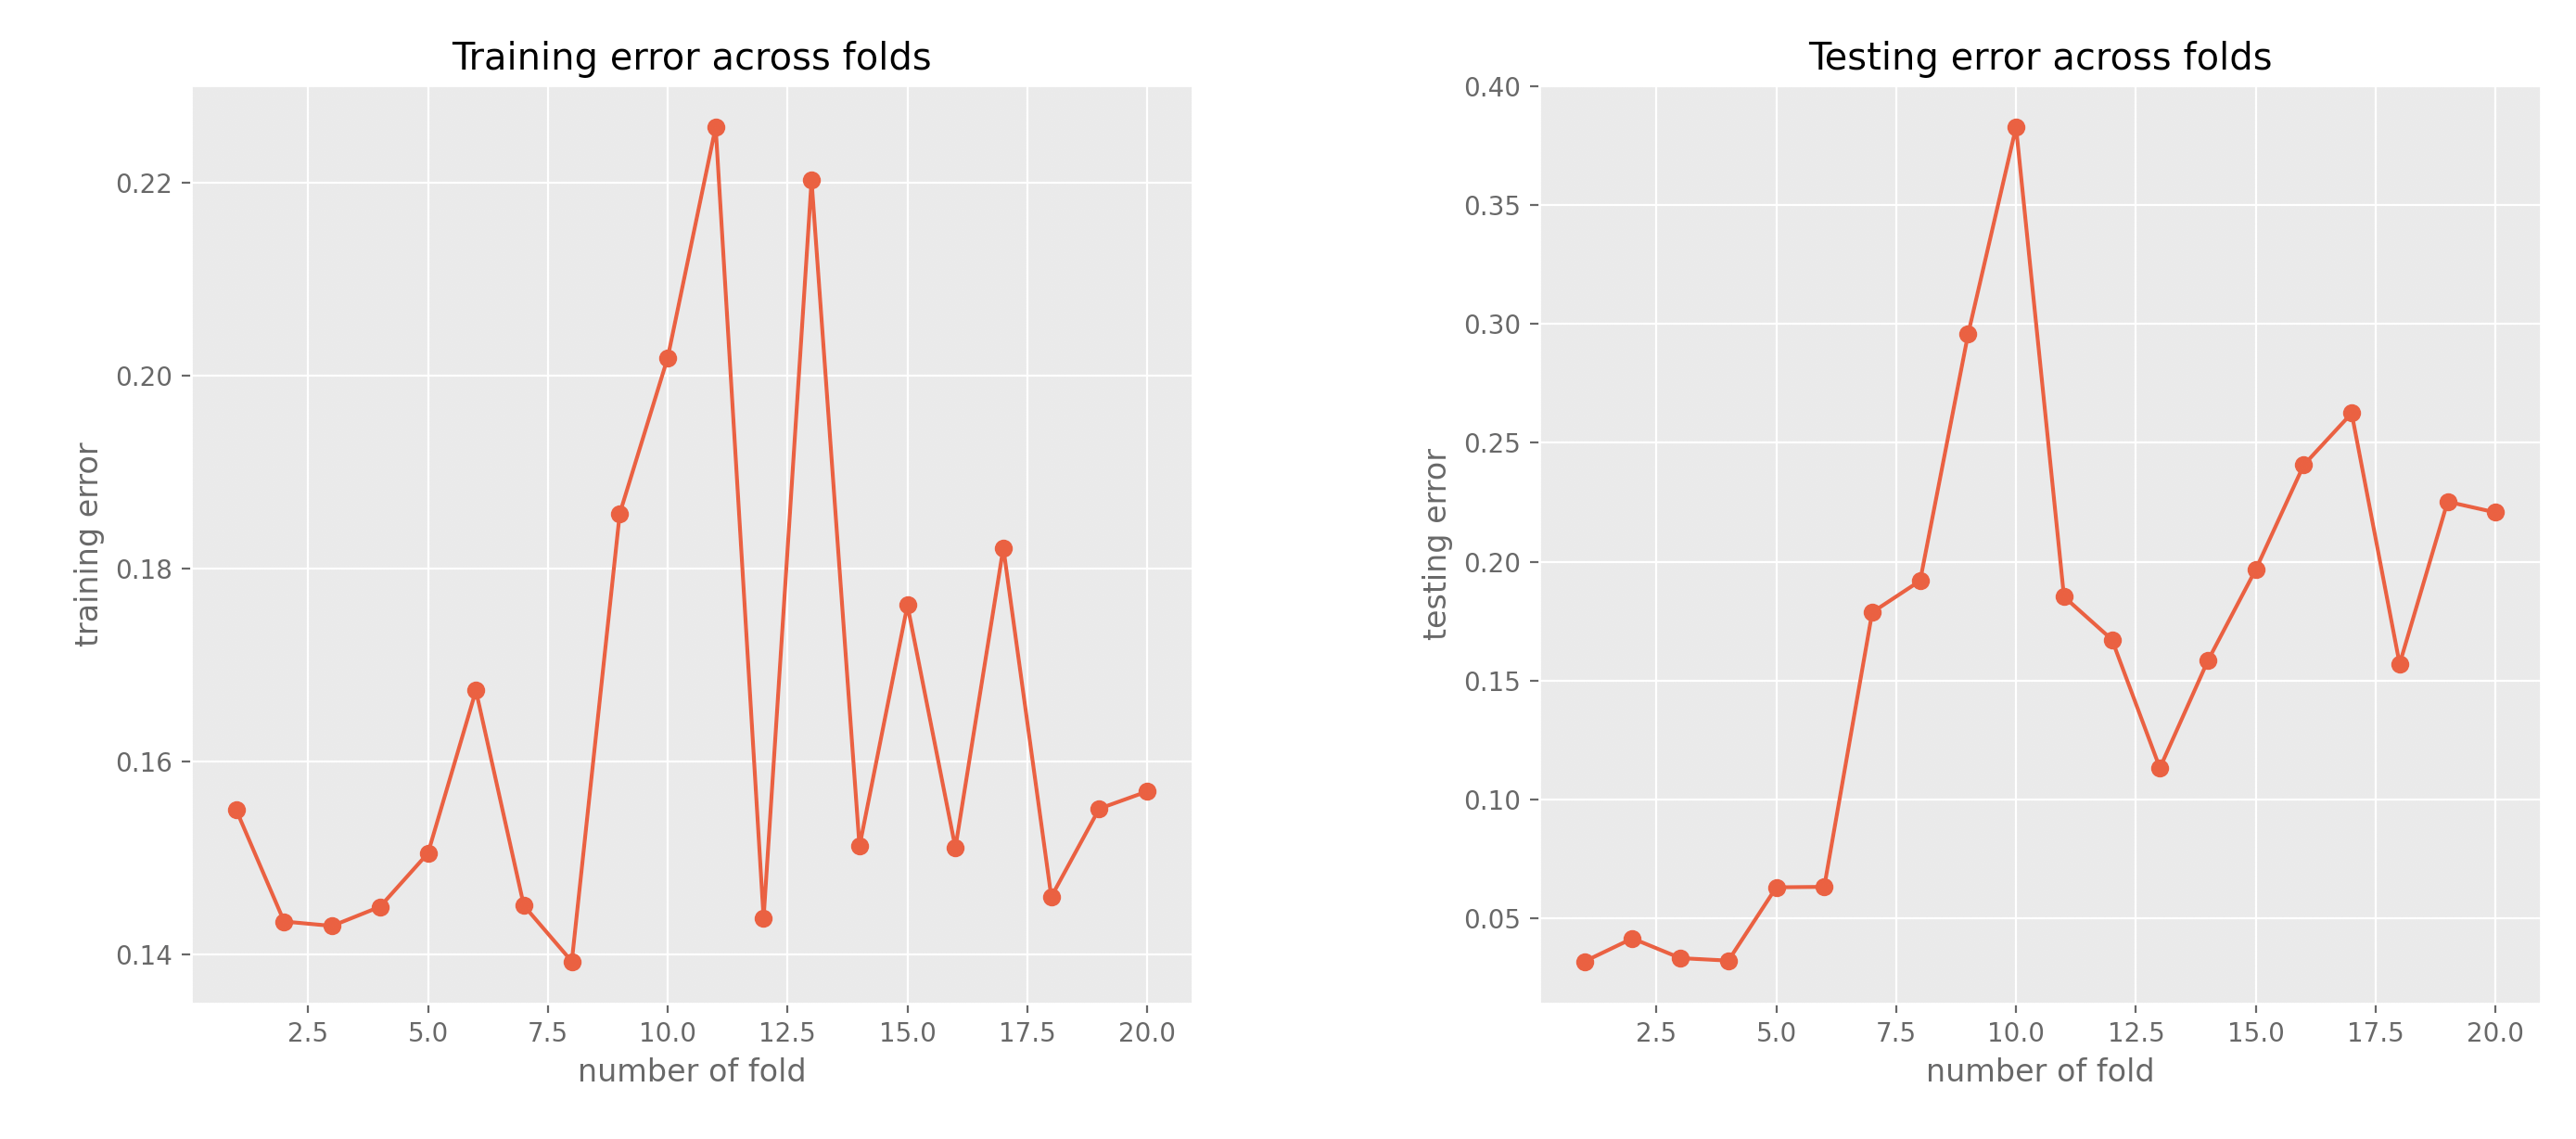 Figure created by the author.
Learn this step by step with the interactive AI and Data Scientist and Machine Learning roadmaps.
1. Introduction
Most of the times, the cause of poor performance for a machine learning (ML) model is either overfitting or underfitting. A good model should be able to generalize and overcome both the overfitting and underfitting problems. But what is overfitting? But what is underfitting? When does it mean for a model to be able to generalize the learned function/rule ?
Read on and you will be able to answer all these questions.
- NEW : After a great deal of hard work and staying behind the scenes for quite a while, we're excited to now offer our expertise through a platform, the "Data Science Hub" on Patreon (https://www.patreon.com/TheDataScienceHub). This hub is our way of providing you with bespoke consulting services and comprehensive responses to all your inquiries , ranging from Machine Learning to strategic data analytics planning.
2. What is generalization in ML
Generalization of a ML model refers to how well the rules/patterns/functions learned by the ML model, apply to specific examples not seen by the model when it was learning. This is usually called the unseen set or the test set.
The goal of a good ML model is to generalize well from the training data to any data that is coming from the problem's domain. This allows the prediction of some data that the model has NEVER seen before (i.e. making prediction in the future).
Another resource. Learn Data Science and ML with the help of an 🤖 AI-powered tutor. Start here https://aigents.co/learn choose a topic and he will show up where you need him. No paywall, no signups, no ads.
3. What is Overfitting in Machine Learning
Overfitting means that our ML model is modeling (has learned) the training data too well.
Formally, overfitting referes to the situation where a model learns the data but also the noise that is part of training data to the extent that it negatively impacts the performance of the model on new unseen data.
In other worlds, the noise (i.e. random fluctuations) in the training set is learned as rules/pattenrs by the model. However, these noisy learned representations do not apply to new unseen data and thus, the model's performance (i.e. accuracy, MSE, MAE) is negatively impacted.
A textbook case of overfitting is when the model's error on the training set (i.e. during training) is very low but then, the model's error on the test set (i.e. unseen samples) is large !
4. What is Underfitting in Machine Learning
Underfitting means that our ML model can neither model the training data nor generalize to new unseen data.
A model that underfits the data will have poor performance on the training data. For example, in a scenario where someone would use a linear model to capture non-linear trends in the data, the model would underfit the data.
A textbook case of underfitting is when the model's error on both the training and test sets (i.e. during training and testing) is very high.
5. The sweet spot and good models
It is obvious that there is a trade-off between overfitting and underfitting.
Ideally, a good model is a model that finds the sweet spot between underfitting and overfitting.
Which is the sweet spot?
The sweet spot is defined as the point where the model's error on the training set and the test (unseen) test set remain both low.
In other words, the sweet spot is the spot where the error on the test set starts to increase and, at the same time, the model's error on the training set is acceptable (low).
6. How to (potentially) limit Overfitting
The most common problem in the ML learning filed is overfitting.
Action that could (potentially) limit overfitting:
- We can use a Cross-validation (CV) scheme.
- Reduce the complexity of the model (make the model less complex).
When it comes to solution 1 i.e.__the use of cross-validation , the most famous CV scheme is the KFolds cross-validation. Using a KFolds scheme, we train and test your model k-times on different subsets of the training data and estimate a performance metric using the test (unseen) data. Other options include the Leave-one -out cross-validation (LOOCV), the Leave-P-out cross-validation (LpOCV) and others.
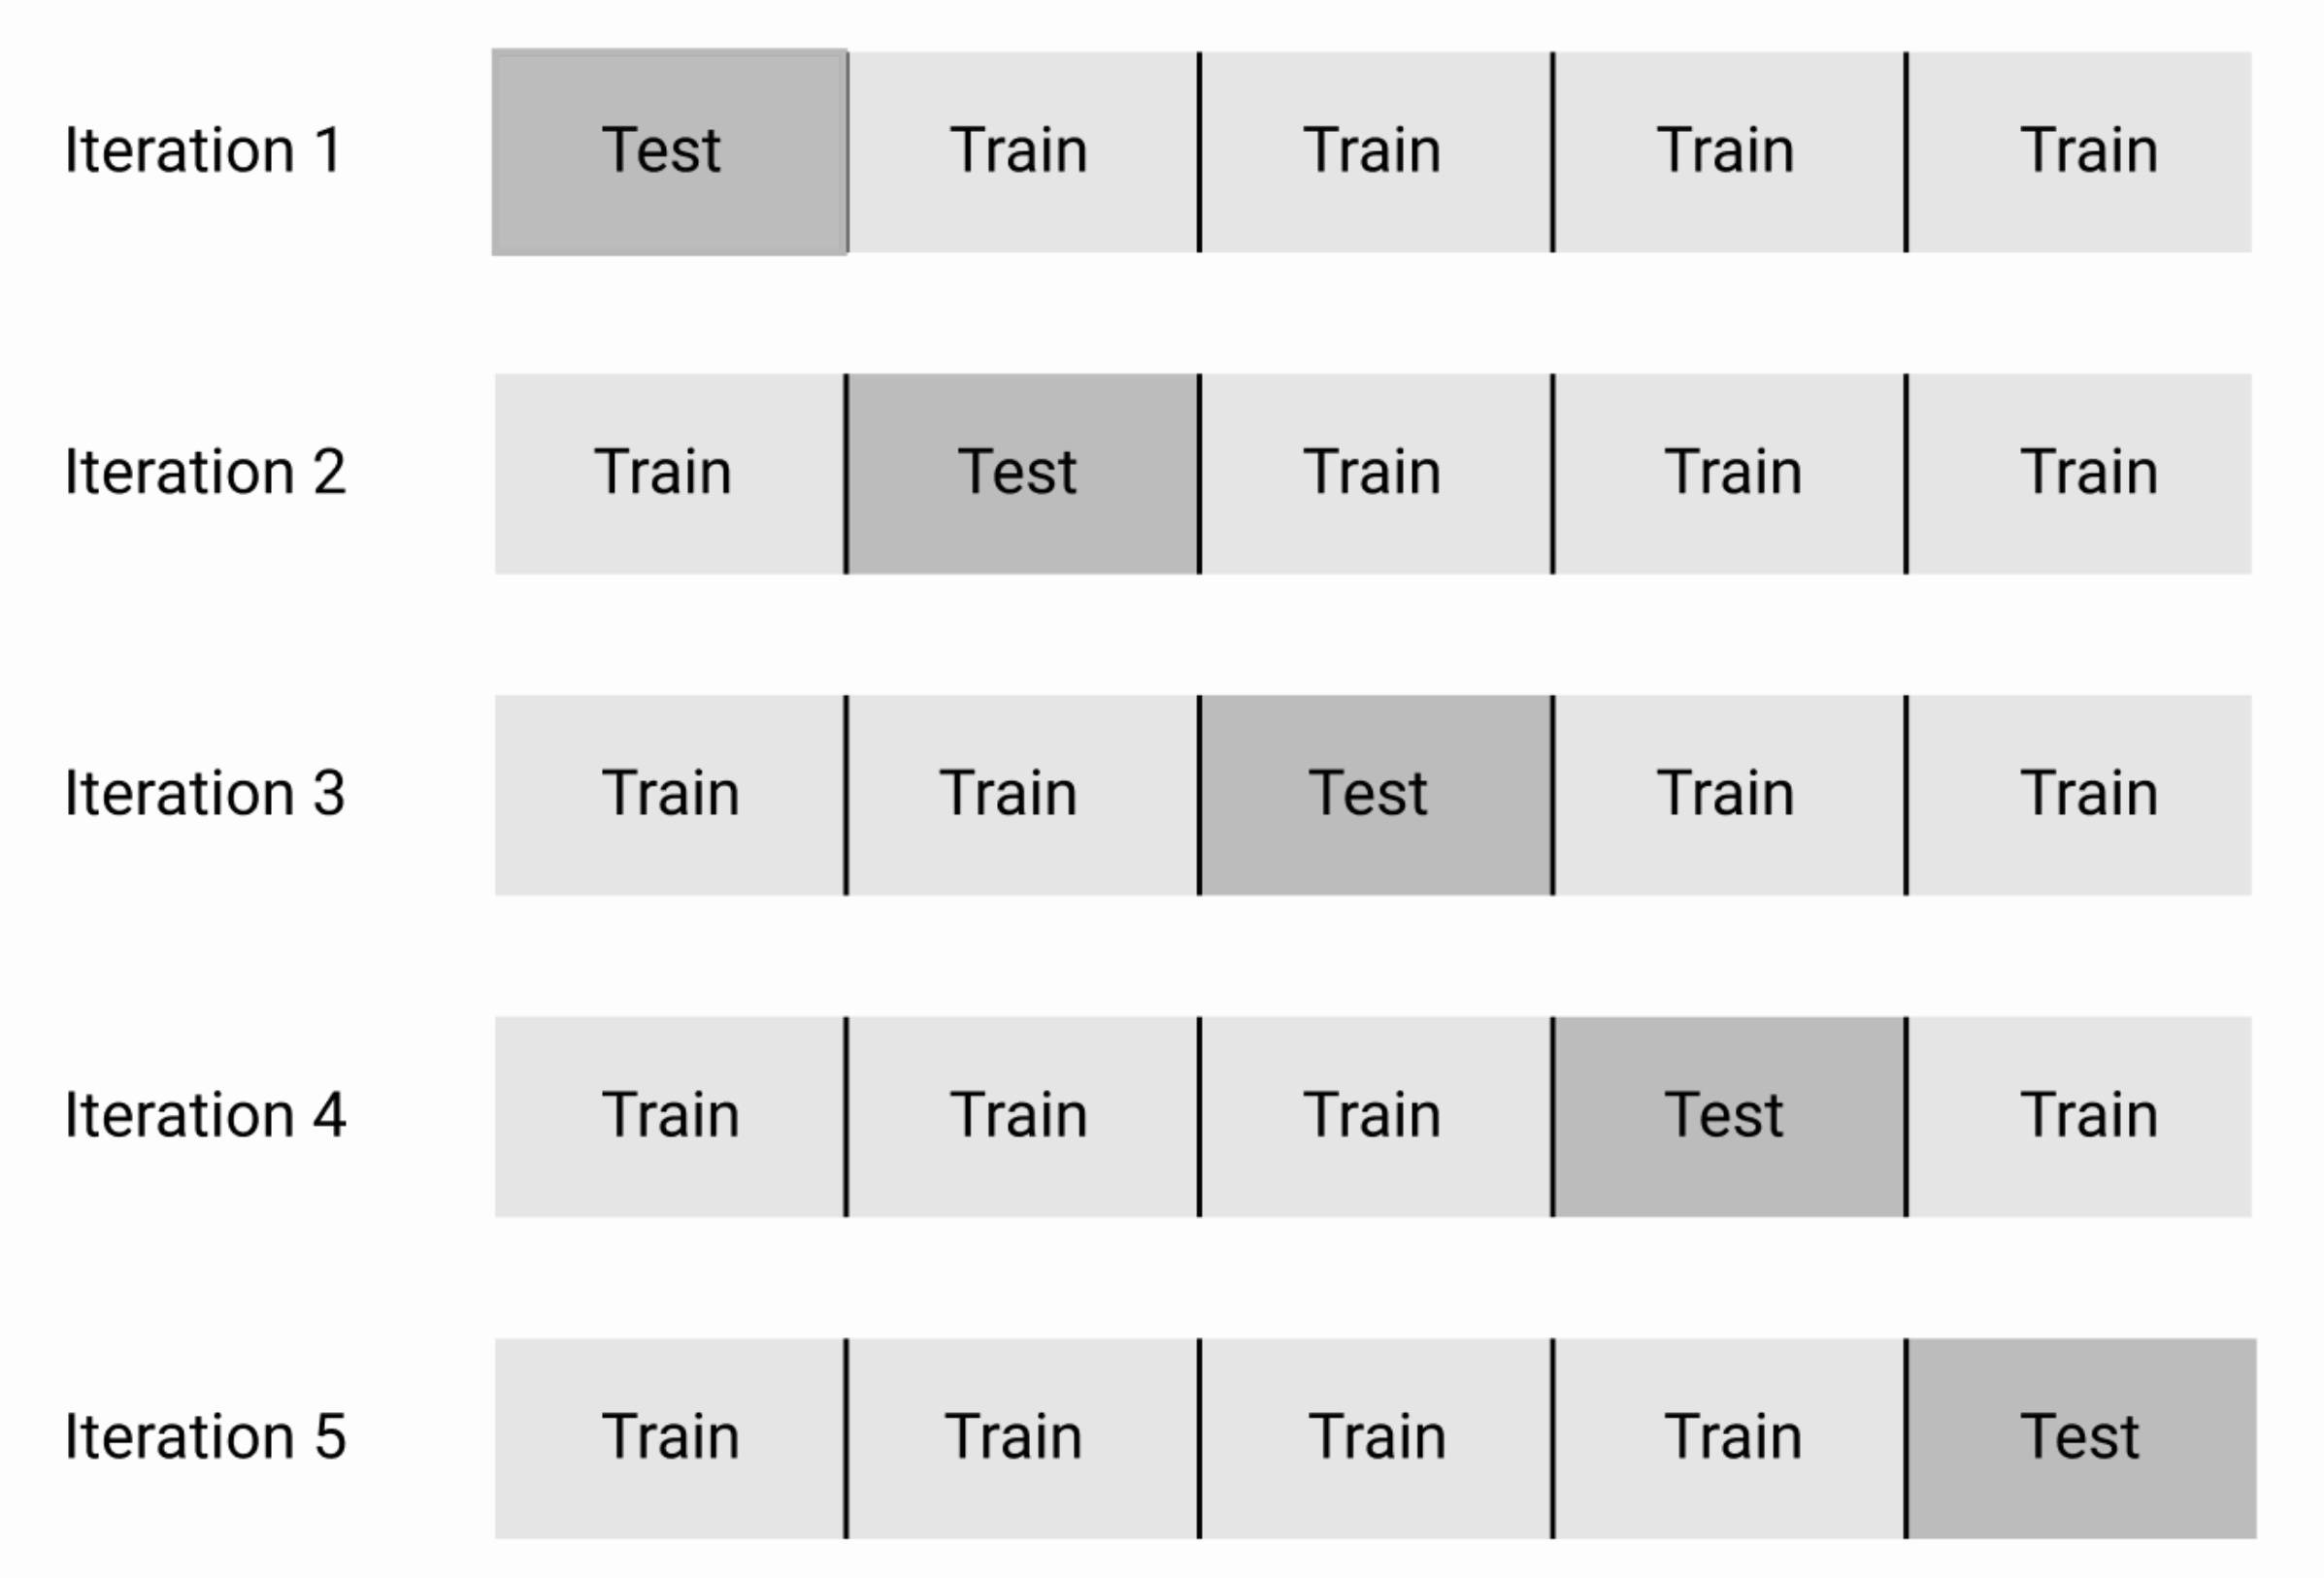 KFold visually represented. Figure created by the author.
When it comes to solution 2 i.e.__reducing the complexity of the model can help reduce the overfitting. For example, if someone is using an SVM model with RBF kernel then reducing the complexity would mean to use a linear kernel. In another case, if someone is fitting a polynomial to some data, then reducing the complexity would mean to fit a linear model instead (linear regression).
7. How to (potentially) limit Underfitting
In that case, there are 2 gold standard approaches:
- Try another model
- Increase the complexity of the current model
Solution 1 is trivial. Concerning solution 2, an example an be the following: if someone is fitting a linear regression to some data, then increasing the complexity would mean to fit a polynomial model.
8. Conclusions
Overfitting or underfitting are the most common causes of poor performance for most machine learning (ML) models. Additionally, overfitting is more common than underfitting.
- Overfitting is when the model's error on the training set (i.e. during training) is very low but then, the model's error on the test set (i.e. unseen samples) is large!
- Underfitting is when the model's error on both the training and test sets (i.e. during training and testing) is very high.
To overcome these problems, cross-validation is usually used in order to estimate the model's performance on unseen data.
BONUS: Working example in Python
The dataset
We will use the Iris Dataset as we have done in all my previous posts. The dataset contains four features (length and width of sepals and petals) of 50 samples of three species of Iris (Iris setosa , Iris virginica and Iris versicolor).
The model
We will use a multilayer perceptron (MLP) regressor. A MLP is a class of feedforward artificial neural network (ANN). The term MLP is used ambiguously, sometimes loosely to any feedforward ANN, sometimes strictly to refer to networks composed of multiple layers of perceptrons.
text
from sklearn.neural_network import MLPRegressor
from sklearn.metrics import mean_absolute_error
import numpy as np
from sklearn.model_selection import validation_curve
from sklearn.datasets import load_iris
import matplotlib.pyplot as plt
from sklearn.model_selection import KFold
np.random.seed(0)
plt.style.use('ggplot')
Let's load the iris data :
text
iris = load_iris()
X, y = iris.data, iris.target
We will use KFolds cross -validation with 20 folds (K=20) to evaluate the generalization ability of our model. Within each fold we will estimate the training and test error using the training and test sets, respectively.
text
kf = KFold(n_splits=20)
list_training_error = []
list_testing_error = []
text
for train_index, test_index in kf.split(X):
    X_train, X_test = X[train_index], X[test_index]
    y_train, y_test = y[train_index], y[test_index]
    model = MLPRegressor()
    model.fit(X_train, y_train)
    y_train_data_pred = model.predict(X_train)
    y_test_data_pred = model.predict(X_test)
text
    fold_training_error = mean_absolute_error(y_train, y_train_data_pred)
    fold_testing_error = mean_absolute_error(y_test, y_test_data_pred)
    list_training_error.append(fold_training_error)
    list_testing_error.append(fold_testing_error)
Plot the MAE of the training phase and the MAE of the testing phase:
text
plt.subplot(1,2,1)
plt.plot(range(1, kf.get_n_splits() + 1), np.array(list_training_error).ravel(), 'o-')
plt.xlabel('number of fold')
plt.ylabel('training error')
plt.title('Training error across folds')
plt.tight_layout()
text
plt.subplot(1,2,2)
plt.plot(range(1, kf.get_n_splits() + 1), np.array(list_testing_error).ravel(), 'o-')
plt.xlabel('number of fold')
plt.ylabel('testing error')
plt.title('Testing error across folds')
plt.tight_layout()
text
plt.show()
Let's now interpret the results and try to spot overfitting and underfitting points.
Reminder :
- Overfitting is when the model's error on the training set (i.e. during training) is very low but then, the model's error on the test set (i.e. unseen samples) is large!
- Underfitting is when the model's error on both the training and test sets (i.e. during training and testing) is very high.
An underfitting point can be identified at fold number 10. During the 10th fold, the error on the training set and test set is at the same time high! So the model underfits the portion of the training data that are passed in for training in fold 10.
An overfitting point (not really extreme) can be seen at fold 20. The training MAE is around 0.16 and for the same fold the MAE on the test set is above 0.20.
Disclaimer : These are not extreme cases of overfitting/underfitting but I just wanted to make my point and connect it with the theory I discussed in this article.
That's all folks ! Hope you liked this article!
Stay tuned & support this effort
If you liked and found this article useful, follow me to be able to see all my new posts.
Here is my profile. Click on Follow !
Serafeim Loukas - Towards Data Science
Questions? Post them as a comment and I will reply as soon as possible.
Latest posts
Time-Series Forecasting: Predicting Stock Prices Using Facebook's Prophet Model
ROC Curve Explained using a COVID-19 hypothetical example: Binary & Multi-Class Classification...
Support Vector Machines (SVM) clearly explained: A python tutorial for classification problems...
PCA clearly explained - How, when, why to use it and feature importance: A guide in Python
Everything you need to know about Min-Max normalization in Python
How Scikit-Learn's StandardScaler works
Get in touch with me
Register Now to Continue Reading
Unlock Towards Data Science with a Free Account
All articles on Towards Data Science are available to registered users. Create a free account today to access this article and thousands more.
Register for freeSign in to your account
 Written By
See all from Serafeim Loukas, PhD
Data ScienceMachine LearningNeural NetworksOverfittingUnderfitting
Share This Article
Towards Data Science is a community publication. Submit your insights to reach our global audience and earn through the TDS Author Payment Program.
Write for TDS
Related Articles
Machine Learning
Kenny Daniel | TMLS2019
TDS Editors
July 2, 20201 min read
Data Science
Helping Data Engineers leverage containers, kubernetes and workflows
Robert Heise
June 29, 20215 min read
Machine Learning
Our weekly selection of must-read Editors' Picks and original features
TDS Editors
October 14, 20213 min read
Data Science
This article is a comprehensive guide to help you adopt the right type of database for your use case
Zoumana Keita
September 28, 20226 min read
Artificial Intelligence
Find out how the inverted file index (IVF) is implemented alongside product quantization (PQ) for a fast and efficient approximate nearest...
Peggy Chang
May 25, 20229 min read
Machine Learning
Classes, attributes, methods, inheritance, encapsulation, and all that other mumbo jumbo you're not sure if you really need (spoiler: for...
Jake
June 16, 20206 min read
Data Science
Make the Most of Your Time to Become a Data Scientist
Scott Andrews
October 20, 20206 min read
Deep Learning
With Python Implementation
Tiago Toledo Jr.
October 25, 20227 min read
Artificial Intelligence
An open source tool from Google to easily analyze ML models without the need to code.
Parul Pandey
May 3, 20198 min read
Your home for data science and AI. The world's leading publication for data science, data analytics, data engineering, machine learning, and artificial intelligence professionals.
Subscribe to Our NewsletterWrite For TDS•About•Advertise•Privacy Policy•Terms of Use
© Insight Media Group, LLC 2026•The New Stack•roadmap.sh•Creator Network
Recommended Articles
Close