保留正文与补采附件。源页面当前未重新核验;具体限制见交付清单。
 We value your privacy
We use cookies to enhance your browsing experience, serve personalised ads or content, and analyse our traffic. By clicking "Accept All", you consent to our use of cookies.
Customise Reject All Accept All
Customise Consent Preferences
 We use cookies to help you navigate efficiently and perform certain functions. You will find detailed information about all cookies under each consent category below.
The cookies that are categorised as "Necessary" are stored on your browser as they are essential for enabling the basic functionalities of the site. ... Show more
NecessaryAlways Active
Necessary cookies are required to enable the basic features of this site, such as providing secure log-in or adjusting your consent preferences. These cookies do not store any personally identifiable data.
-
Cookie
BCTempID
-
Duration
10 minutes
-
Description
No description available.
-
Cookie
__cf_bm
-
Duration
1 hour
-
Description
This cookie, set by Cloudflare, is used to support Cloudflare Bot Management.
-
Cookie
AWSALBCORS
-
Duration
7 days
-
Description
Amazon Web Services set this cookie for load balancing.
-
Cookie
_cfuvid
-
Duration
session
-
Description
Cloudflare sets this cookie to track users across sessions to optimize user experience by maintaining session consistency and providing personalized services
-
Cookie
li_gc
-
Duration
6 months
-
Description
Linkedin set this cookie for storing visitor's consent regarding using cookies for non-essential purposes.
-
Cookie
__hssrc
-
Duration
session
-
Description
This cookie is set by Hubspot whenever it changes the session cookie. The __hssrc cookie set to 1 indicates that the user has restarted the browser, and if the cookie does not exist, it is assumed to be a new session.
-
Cookie
__hssc
-
Duration
1 hour
-
Description
HubSpot sets this cookie to keep track of sessions and to determine if HubSpot should increment the session number and timestamps in the __hstc cookie.
-
Cookie
wpEmojiSettingsSupports
-
Duration
session
-
Description
WordPress sets this cookie when a user interacts with emojis on a WordPress site. It helps determine if the user's browser can display emojis properly.
-
Cookie
BCSessionID
-
Duration
1 year 1 month 4 days
-
Description
Blueconic sets this cookie as a unique identifier for the BlueConic profile.
-
Cookie
_octo
-
Duration
1 year
-
Description
No description available.
-
Cookie
logged_in
-
Duration
1 year
-
Description
No description available.
-
Cookie
__Secure-YEC
-
Duration
past
-
Description
YouTube sets this cookie to stores the user's video player preferences using embedded YouTube video
-
Cookie
__eoi
-
Duration
6 months
-
Description
Description is currently not available.
-
Cookie
AWSALBTGCORS
-
Duration
7 days
-
Description
No description available.
-
Cookie
login-status-p
-
Duration
past
-
Description
Description is currently not available.
-
Cookie
AWSALBTG
-
Duration
7 days
-
Description
No description available.
-
Cookie
csrf_token
-
Duration
session
-
Description
No description available.
-
Cookie
token_v2
-
Duration
1 day
-
Description
Description is currently not available.
-
Cookie
D
-
Duration
1 year
-
Description
Description is currently not available.
-
Cookie
PHPSESSID
-
Duration
session
-
Description
This cookie is native to PHP applications. The cookie stores and identifies a user's unique session ID to manage user sessions on the website. The cookie is a session cookie and will be deleted when all the browser windows are closed.
-
Cookie
VISITOR_PRIVACY_METADATA
-
Duration
6 months
-
Description
YouTube sets this cookie to store the user's cookie consent state for the current domain.
-
Cookie
cookietest
-
Duration
session
-
Description
The cookietest cookie is typically used to determine whether the user's browser accepts cookies, essential for website functionality and user experience.
-
Cookie
__Host-airtable-session
-
Duration
1 year
-
Description
This cookie is used to enable us to integrate the services of Airtable.
-
Cookie
__Host-airtable-session.sig
-
Duration
1 year
-
Description
This cookie is used to enable us to integrate the services of Airtable.
-
Cookie
m
-
Duration
1 year 1 month 4 days
-
Description
Stripe sets this cookie for fraud prevention purposes. It identifies the device used to access the website, allowing the website to be formatted accordingly.
-
Cookie
BIGipServer*
-
Duration
session
-
Description
Marketo sets this cookie to collect information about the user's online activity and build a profile about their interests to provide advertisements relevant to the user.
-
Cookie
__cfruid
-
Duration
session
-
Description
Cloudflare sets this cookie to identify trusted web traffic.
-
Cookie
_GRECAPTCHA
-
Duration
6 months
-
Description
Google Recaptcha service sets this cookie to identify bots to protect the website against malicious spam attacks.
-
Cookie
__Secure-YNID
-
Duration
6 months
-
Description
Google cookie used to protect user security and prevent fraud, especially during the login process.
-
Cookie
cookieyes-consent
-
Duration
1 year
-
Description
CookieYes sets this cookie to remember users' consent preferences so that their preferences are respected on subsequent visits to this site. It does not collect or store any personal information about the site visitors.
Functional
Functional cookies help perform certain functionalities like sharing the content of the website on social media platforms, collecting feedback, and other third-party features.
-
Cookie
lidc
-
Duration
1 day
-
Description
LinkedIn sets the lidc cookie to facilitate data center selection.
-
Cookie
brw
-
Duration
1 year
-
Description
No description available.
-
Cookie
brwConsent
-
Duration
5 minutes
-
Description
Description is currently not available.
-
Cookie
WMF-Uniq
-
Duration
1 year
-
Description
Description is currently not available.
-
Cookie
loom_anon_comment
-
Duration
1 year
-
Description
No description available.
-
Cookie
loom_referral_video
-
Duration
session
-
Description
Description is currently not available.
-
Cookie
VISITOR_INFO1_LIVE
-
Duration
6 months
-
Description
A cookie set by YouTube to measure bandwidth that determines whether the user gets the new or old player interface.
-
Cookie
yt-remote-connected-devices
-
Duration
Never Expires
-
Description
YouTube sets this cookie to store the user's video preferences using embedded YouTube videos.
-
Cookie
ytidb::LAST_RESULT_ENTRY_KEY
-
Duration
Never Expires
-
Description
The cookie ytidb::LAST_RESULT_ENTRY_KEY is used by YouTube to store the last search result entry that was clicked by the user. This information is used to improve the user experience by providing more relevant search results in the future.
-
Cookie
yt-remote-device-id
-
Duration
Never Expires
-
Description
YouTube sets this cookie to store the user's video preferences using embedded YouTube videos.
-
Cookie
yt-remote-session-name
-
Duration
session
-
Description
The yt-remote-session-name cookie is used by YouTube to store the user's video player preferences using embedded YouTube video.
-
Cookie
yt-remote-fast-check-period
-
Duration
session
-
Description
The yt-remote-fast-check-period cookie is used by YouTube to store the user's video player preferences for embedded YouTube videos.
-
Cookie
yt-remote-session-app
-
Duration
session
-
Description
The yt-remote-session-app cookie is used by YouTube to store user preferences and information about the interface of the embedded YouTube video player.
-
Cookie
yt-remote-cast-available
-
Duration
session
-
Description
The yt-remote-cast-available cookie is used to store the user's preferences regarding whether casting is available on their YouTube video player.
-
Cookie
yt-remote-cast-installed
-
Duration
session
-
Description
The yt-remote-cast-installed cookie is used to store the user's video player preferences using embedded YouTube video.
-
Cookie
cp_session
-
Duration
3 months
-
Description
Codepen sets this cookie for Help systems found in the website.
-
Cookie
loid
-
Duration
1 year 1 month 4 days
-
Description
This cookie is set by the Reddit. The cookie enables the sharing of content from the website onto the social media platform.
Analytics
Analytical cookies are used to understand how visitors interact with the website. These cookies help provide information on metrics such as the number of visitors, bounce rate, traffic source, etc.
-
Cookie
__hstc
-
Duration
6 months
-
Description
Hubspot set this main cookie for tracking visitors. It contains the domain, initial timestamp (first visit), last timestamp (last visit), current timestamp (this visit), and session number (increments for each subsequent session).
-
Cookie
hubspotutk
-
Duration
6 months
-
Description
HubSpot sets this cookie to keep track of the visitors to the website. This cookie is passed to HubSpot on form submission and used when deduplicating contacts.
-
Cookie
_ga
-
Duration
1 year 1 month 4 days
-
Description
Google Analytics sets this cookie to calculate visitor, session and campaign data and track site usage for the site's analytics report. The cookie stores information anonymously and assigns a randomly generated number to recognise unique visitors.
-
Cookie
ga*
-
Duration
1 year 1 month 4 days
-
Description
Google Analytics sets this cookie to store and count page views.
-
Cookie
__Host-psifi.analyticsTrace
-
Duration
6 hours
-
Description
Description is currently not available.
-
Cookie
__Host-psifi.analyticsTraceV2
-
Duration
6 hours
-
Description
Description is currently not available.
-
Cookie
_gh_sess
-
Duration
session
-
Description
GitHub sets this cookie for temporary application and framework state between pages like what step the user is on in a multiple step form.
-
Cookie
YSC
-
Duration
session
-
Description
YSC cookie is set by Youtube and is used to track the views of embedded videos on Youtube pages.
-
Cookie
ajs_anonymous_id
-
Duration
1 year
-
Description
This cookie is set by Segment to count the number of people who visit a certain site by tracking if they have visited before.
-
Cookie
vuid
-
Duration
1 year 1 month 4 days
-
Description
Vimeo installs this cookie to collect tracking information by setting a unique ID to embed videos on the website.
Performance
Performance cookies are used to understand and analyse the key performance indexes of the website which helps in delivering a better user experience for the visitors.
-
Cookie
AWSALB
-
Duration
7 days
-
Description
AWSALB is an application load balancer cookie set by Amazon Web Services to map the session to the target.
-
Cookie
acq
-
Duration
past
-
Description
Description is currently not available.
-
Cookie
acq.sig
-
Duration
past
-
Description
Description is currently not available.
-
Cookie
ptc
-
Duration
2 years
-
Description
No description available.
Advertisement
Advertisement cookies are used to provide visitors with customised advertisements based on the pages you visited previously and to analyse the effectiveness of the ad campaigns.
-
Cookie
muc_ads
-
Duration
1 year 1 month 4 days
-
Description
Twitter sets this cookie to collect user behaviour and interaction data to optimize the website.
-
Cookie
guest_id_marketing
-
Duration
1 year 1 month 4 days
-
Description
Twitter sets this cookie to identify and track the website visitor.
-
Cookie
guest_id_ads
-
Duration
1 year 1 month 4 days
-
Description
Twitter sets this cookie to identify and track the website visitor.
-
Cookie
personalization_id
-
Duration
1 year 1 month 4 days
-
Description
Twitter sets this cookie to integrate and share features for social media and also store information about how the user uses the website, for tracking and targeting.
-
Cookie
guest_id
-
Duration
1 year 1 month 4 days
-
Description
Twitter sets this cookie to identify and track the website visitor. It registers if a user is signed in to the Twitter platform and collects information about ad preferences.
-
Cookie
bcookie
-
Duration
1 year
-
Description
LinkedIn sets this cookie from LinkedIn share buttons and ad tags to recognize browser IDs.
-
Cookie
__Secure-ROLLOUT_TOKEN
-
Duration
6 months
-
Description
YouTube sets this cookie to manage feature rollout and experimentation. It helps Google control which new features or interface changes are shown to users as part of testing and staged rollouts, ensuring consistent experience for a given user during an experiment.
-
Cookie
yt.innertube::nextId
-
Duration
Never Expires
-
Description
YouTube sets this cookie to register a unique ID to store data on what videos from YouTube the user has seen.
-
Cookie
yt.innertube::requests
-
Duration
Never Expires
-
Description
YouTube sets this cookie to register a unique ID to store data on what videos from YouTube the user has seen.
-
Cookie
session_tracker
-
Duration
session
-
Description
This cookie is set by the Reddit. This cookie is used to identify trusted web traffic. It also helps in adverstising on the website.
-
Cookie
edgebucket
-
Duration
session
-
Description
Reddit sets this cookie to save the information about a log-on Reddit user, for the purpose of advertisement recommendations and updating the content.
-
Cookie
did
-
Duration
1 year
-
Description
Arbor sets this cookie to show targeted ads to site visitors.This cookie expires after 2 months or 1 year.
Uncategorised
Other uncategorised cookies are those that are being analysed and have not been classified into a category as yet.
No cookies to display.
Reject All Save My Preferences Accept All
Toggle SearchToggle Mobile Navigation
Publish AI, ML & data-science insights to a global community of data professionals.
Sign inSubmit an Article
LatestEditor's PicksNewsletterShipAI
Write For TDS
LinkedInXToggle Search
Data Science
EDA in Public (Part 3): RFM Analysis for Customer Segmentation in Pandas
How to build, score, and interpret RFM segments step by step
Ibrahim Salami
January 1, 202612 min read
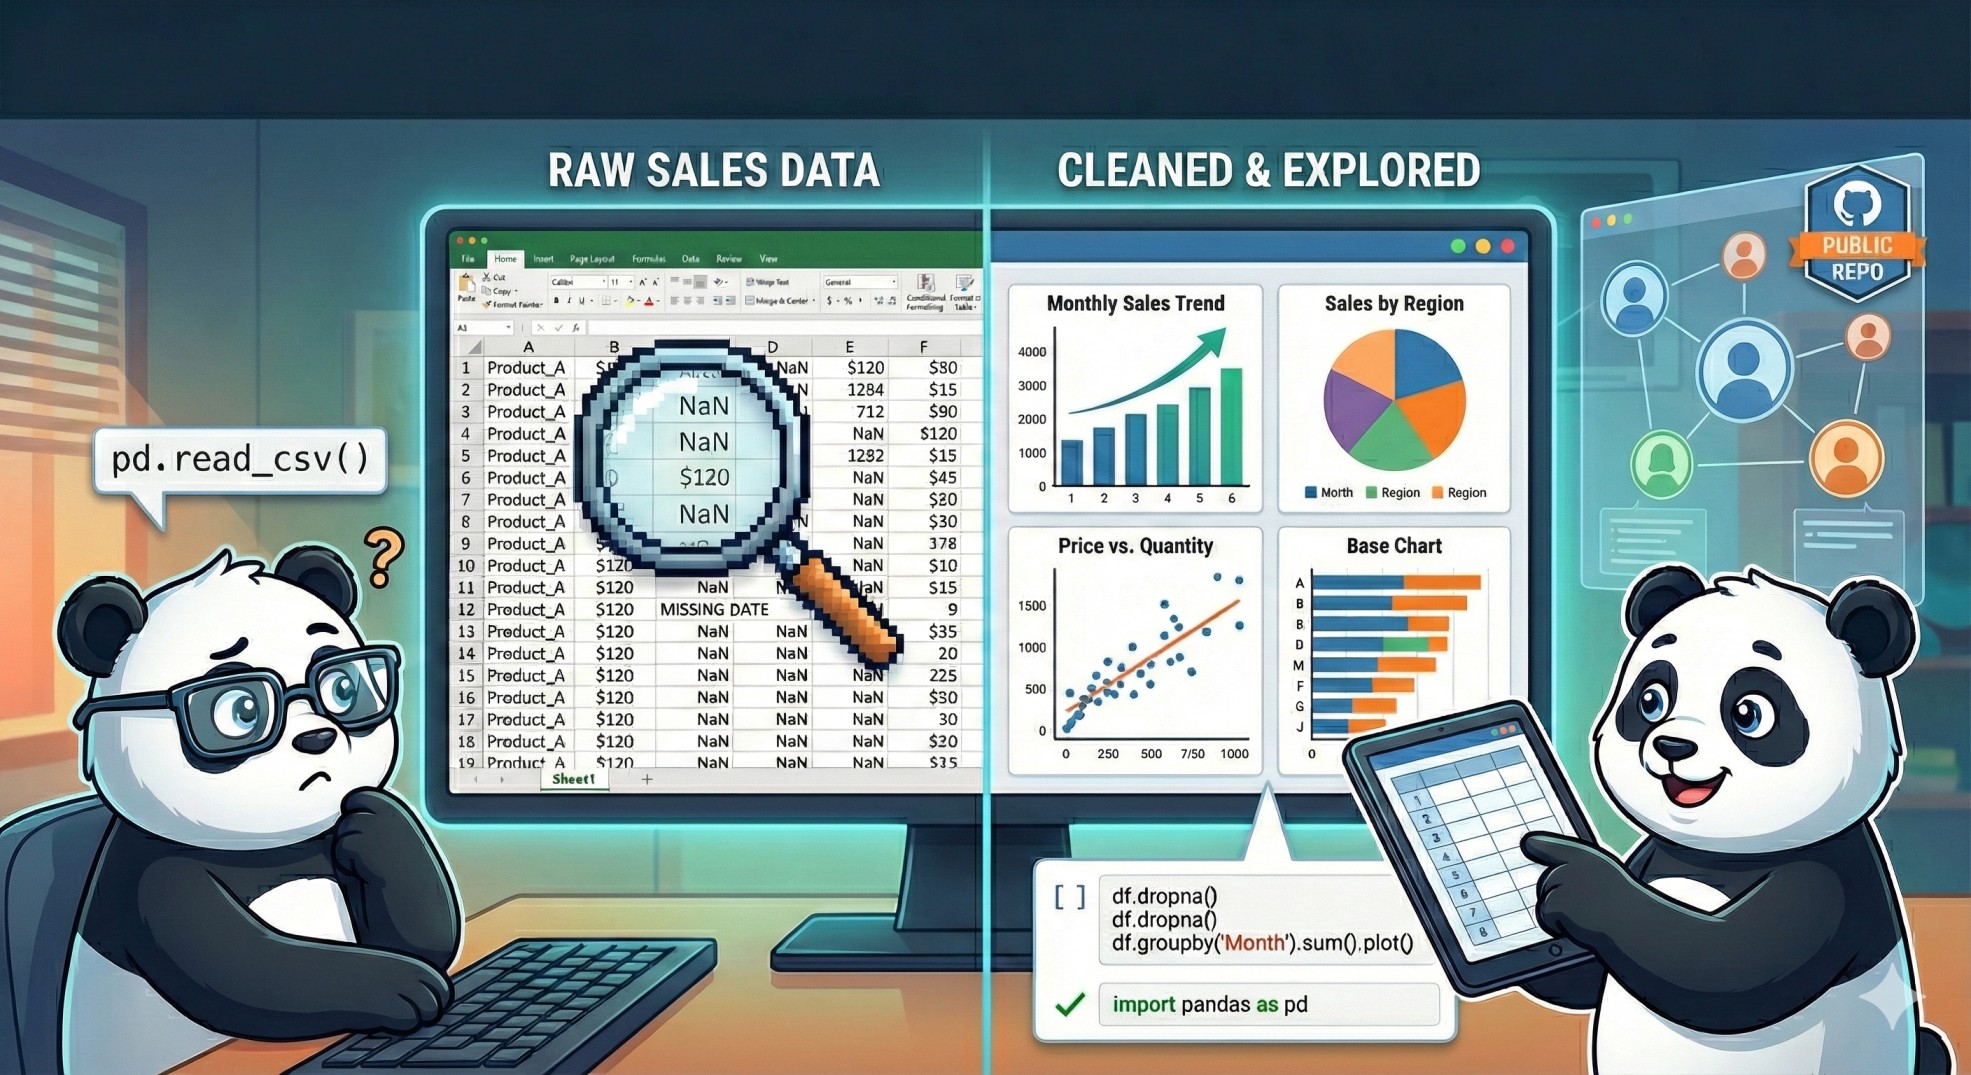 Image by Author. Created with Gemini
Welcome back! If you’ve been following along, we’ve come a long way. In Part 1, we did the “dirty work” of cleaning and prepping.
In Part 2, we zoomed out to a high-altitude view of NovaShop’s world — spotting the big storms (high-revenue countries) and the seasonal patterns (the massive Q4 rush).
But here’s the thing: a business doesn’t actually sell to “months” or “countries.” It sells to human beings.
If you treat every customer exactly the same, you’re making two very expensive mistakes:
- Over-discounting: Giving a “20% off” coupon to someone who was already reaching for their wallet.
- Ignoring the “Quiet” Ones: Failing to notice when a formerly loyal customer stops visiting, until they’ve been gone for six months and it’s too late to win them back.
The Solution? Behavioural Segmentation.
Instead of guessing, we’re going to use the data to let the customers tell us who they are. We do this using the gold standard of retail analytics: RFM Analysis.
- Recency (R): How recently did they buy? (Are they still engaged with us?)
- Frequency (F): How often do they buy? (Are they loyal, or was it a one-off?)
- Monetary (M): How much do they spend? (What is their total business impact?)
By the end of this part, we’ll move beyond “Top 10 Products” and actually assign a specific, actionable Label to every single customer in NovaShop’s database.
Learn this step by step with the interactive AI and Data Scientist roadmap.
Data Preparation: The “Missing ID” Pivot
Before we can start scoring, we have to address a decision we made back in Part 1.
If you remember our Initial Inspection , we noticed that about 25% of our rows were missing a CustomerID. At the time, we made a strategic business decision to keep those rows. We needed them to calculate the accurate total revenue and see which products were popular overall.
For RFM analysis, the rules change. You cannot track behavior without a consistent identity. We can’t know how “frequent” a customer is if we don’t know who they are!
So, our first step in Part 3 is to isolate our “Trackable Universe” by filtering for rows where a CustomerID exists.
Engineering the RFM Metrics
Now that we have a dataset where every row is linked to a specific person, we need to aggregate all their individual transactions into three summary numbers: Recency, Frequency, and Monetary.
Defining the Snapshot Date
Before calculating RFM, we need a reference point in time , commonly called the snapshot date.
Here, we take the most recent transaction date in the dataset and add one day. This snapshot date represents the moment at which we’re evaluating customer behaviour.
python
snapshot_date = df['InvoiceDate'].max() + dt.timedelta(days=1)
We added one day, so customers who bought on the most recent date still have a Recency value of 1 day, not 0. This keeps the metric intuitive and avoids edge-case problems.
Aggregating Transactions at the Customer Level
python
rfm = df.groupby(‘CustomerID’).agg({
‘InvoiceDate’: lambda x: (snapshot_date — x.max()).days,
‘InvoiceNo’: ‘nunique’,
‘Revenue’: ‘sum’
})
Each row in our dataset represents a single transaction. To calculate RFM, we need to collapse these transactions into one row per customer.
We do this by grouping the data by CustomerID and applying different aggregation functions:
- Recency : For each customer, we find their most recent purchase date and calculate how many days have passed since then.
- Frequency: We count the number of unique invoices associated with each customer. This tells us how often they’ve made purchases.
- Monetary : We sum the total revenue generated by each customer across all transactions.
Renaming Columns for Clarity
python
rfm.rename(columns={
'InvoiceDate': 'Recency',
'InvoiceNo': 'Frequency',
'Revenue': 'Monetary'
}, inplace=True)py
The aggregation step keeps the original column names, which can be confusing. Renaming them makes the dataframe immediately readable and aligns it with standard RFM terminology.
Now each column clearly answers a business question:
- Recency → How recently did the customer purchase?
- Frequency → How often do they purchase?
- Monetary → How much revenue do they generate?
Inspecting the Result
python
print(rfm.head())
The final rfm dataframe contains one row per customer , with three intuitive metrics summarizing their behavior.
Output:
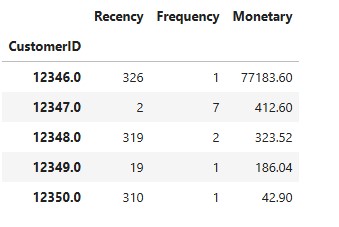 Let’s walk through this the way we would with NovaShop in a real conversation.
“When was the last time this customer bought from us?”
That’s exactly what Recency answers.
Take Customer 12347 :
- Recency = 2
- Translation: “This customer bought something just two days ago.”
They’re fresh. They remember the brand. They’re still engaged.
Now compare that to Customer 12346 :
- Recency = 326
- Translation: “They haven’t bought anything in almost a year.”
Even though this customer spent a lot in the past, they’re currently silent.
From NovaShop’s perspective: Recency tells us who’s still listening and who might need a nudge (or a wake-up call).
“Is this a one-time buyer or someone who keeps coming back?”
That’s where Frequency comes in.
Look again at Customer 12347 :
- Frequency = 7
- They didn’t just buy once — they came back again and again.
Now look at several others:
- Frequency = 1
- One purchase, then gone.
From a business perspective, frequency separates casual shoppers from loyal customers.
“Who actually brings in the money?”
That’s the Monetary column.
And this is where things get interesting.
Customer 12346 :
- Monetary = £77,183.60
- Frequency = 1
- Recency = 326
This tells a very specific story:
A single, very large order… a long time ago… and nothing since.
Now compare that to Customer 12347 :
- Lower total spend
- Multiple purchases
- Very recent activity
Important insight for NovaShop: A “high-value” customer in the past isn’t necessarily a valuable customer today.
Why This View Changes the Conversation
If NovaShop only looked at total revenue, they might focus all their attention on customers like 12346.
But RFM shows us that:
- Some customers spent a lot once and disappeared
- Some spend less but stay loyal
- Some are active right now and ready to be engaged
This output helps NovaShop stop guessing and start prioritizing:
- Who should get retention emails?
- Who needs reactivation campaigns?
- Who is already loyal and should be rewarded?
Right now, these are still raw numbers.
In the next step, we’ll rank and score these customers, so NovaShop doesn’t have to interpret rows manually. Instead, they’ll see clear segments like:
- Champions
- Loyal Customers
- At-Risk
- Lost
That’s where this becomes a real decision-making tool — not just a dataframe.
Turning RFM Numbers Into Meaningful Customer Segments
At this stage, NovaShop has a table full of numbers. Useful — but not exactly decision-friendly.
A marketing team can’t realistically scan hundreds or thousands of rows asking:
- Is a Recency of 19 good or bad?
- Is Frequency = 2 impressive?
- How much Monetary value is “high”?
Our goal is to rank customers relative to one another and turn raw values into scores .
Step 1: Ranking Customers by Each RFM Metric
Instead of treating Recency, Frequency, and Monetary as absolute values, we look at where each customer stands compared to everyone else.
- Customers with more recent purchases should score higher
- Customers who buy more often should score higher
- Customers who spend more should score higher
In practice, we do this by splitting each metric into quantiles (usually 4 or 5 buckets).
However, there’s a small real-world wrinkle. This is something I came across while working on this project
In transactional datasets, it’s common to see:
- Many customers with the same Frequency (e.g. one-time buyers)
- Highly skewed Monetary values
- Small samples where quantile binning can fail
To keep things robust and readable, we’ll wrap the scoring logic in a small helper function.
python
def rfm_score(series, ascending=True, n_bins=5):
# Rank the values to ensure uniqueness
ranked = series.rank(method=’first’, ascending=ascending)

# Use pd.qcut on the ranks to assign bins
return pd.qcut(
ranked,
q=n_bins,
labels=range(1, n_bins+1)
).astype(int)
To explain what’s going on here:
- We’re creating a helper function that turns a raw numeric column into a clean RFM score using quantile-based binning.
- First, the values are ranked.So, instead of binning the raw values directly, we rank them first. This step guarantees unique ordering , even when many customers share the same value (a common issue in RFM data).
- The
ascending flag lets us flip the logic depending on the metric — for example, lower recency is better, while higher frequency and monetary values are better.
- Next, we’re applying quantile-based binning.
qcut splits the ranked values into n_bins equally sized groups. Each customer is assigned a score from 1 to 5 (by default), where the score represents their relative position within the distribution.
- Finally, the results will be converted to integers for easy use in analysis and segmentation.
In short, this function provides a robust and reusable way to score RFM metrics without running into duplicate bin edge errors — and without overcomplicating the logic.
Step 2: Applying the Scores
Now we can score each metric cleanly and consistently:
python
# Assign R, F, M scores
rfm['R_Score'] = rfm_score(rfm['Recency'], ascending=False) # Recent purchases = high score
rfm['F_Score'] = rfm_score(rfm['Frequency']) # More frequent = high score
rfm['M_Score'] = rfm_score(rfm['Monetary']) # Higher spend = high score
The only special case here is Recency :
- Lower values mean more recent activity
- So we reverse the ranking with
ascending=False
- Everything else follows the natural “higher is better” rule.
What This Means for NovaShop
Instead of seeing this:
markup
Recency = 326Frequency = 1Monetary = 77,183.60
NovaShop now sees something like:
markup
R = 1, F = 1, M = 5
That’s instantly more interpretable:
- Not recent
- Not frequent
- High spender (historically)
Step 3: Creating a Combined RFM Score
Now we combine these three scores into a single RFM code:
python
rfm['RFM_Score'] = (
rfm['R_Score'].astype(str) +
rfm['F_Score'].astype(str) +
rfm['M_Score'].astype(str)
)
This produces values like:
- 555 → Best customers
- 155 → High spenders who haven’t returned
- 111 → Customers who are likely gone
Each customer now carries a compact behavioral fingerprint. And we’re not done yet.
Translating RFM Scores Into Customer Segments
Raw scores are nice, but let’s be honest: no marketing manager wants to look at 555, 154, or 311 all day.
NovaShop needs labels that make sense at a glance. That’s where RFM segments come in.
Step 1: Defining Segments
Using RFM scores, we can classify customers into meaningful categories. Here’s a common approach:
- Champions: Top Recency, top Frequency, top Monetary (555) — your best customers
- Loyal Customers: Regular buyers, may not be spending the most, but keep coming back
- Big Spenders: High Monetary, but not necessarily recent or frequent
- At-Risk: Used to buy, but haven’t returned recently
- Lost: Low scores in all three metrics — likely disengaged
- Promising / New: Recent customers with lower frequency or monetary spend
This transforms abstract numbers into a narrative that marketing and management can act on.
Step 2: Mapping Scores to Segments
Here’s an example using simple conditional logic:
python
def rfm_segment(row):
if row['R_Score'] >= 4 and row['F_Score'] >= 4 and row['M_Score'] >= 4:
return 'Champions'
elif row['F_Score'] >= 4:
return 'Loyal Customers'
elif row['M_Score'] >= 4:
return 'Big Spenders'
elif row['R_Score'] <= 2:
return 'At-Risk'
else:
return 'Others'
rfm['Segment'] = rfm.apply(rfm_segment, axis=1)
Now each customer has a human-readable label , making it immediately actionable.
Let’s review our results using rfm.head()
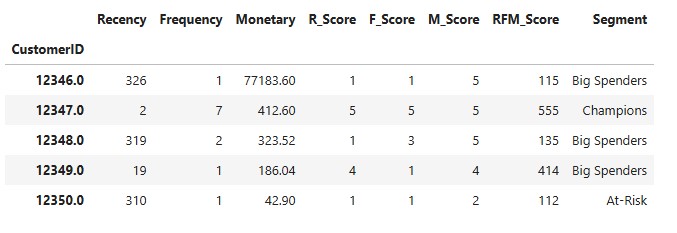
Step 3: Turning Segments into Strategy
With labeled segments, NovaShop can:
- Reward Champions → Exclusive deals, loyalty points
- Re-engage Big Spenders & At-Risk customers → Personalized emails or discounts
- Focus marketing wisely → Don’t waste effort on customers who are truly lost
This is the moment where data becomes strategy.
What NovaShop Should Do Next (Key Takeaways & Recommendations)
At the start of this analysis, NovaShop had a familiar problem:
A lot of transactional data, but limited clarity on customer behaviour.
By applying the RFM framework, we’ve turned raw purchase history into a clear, structured view of who NovaShop’s customers are — and how they behave.
Now let’s talk about what to actually do with it.
1. Protect and Reward Your Best Customers
Champions and Loyal Customers are already doing what every business wants:
- They buy recently
- They buy often
- They generate consistent revenue
These customers don’t need heavy discounts — they need recognition.
Recommended actions:
- Early access to sales
- Loyalty points or VIP tiers
- Personalized thank-you emails
The goal here isn’t acquisition, it’s retention.
2. Re-Engage High-Value Customers Before They’re Lost
The most dangerous segment for NovaShop isn’t “Lost” customers.
It’s At-Risk and Big Spenders.
These customers:
- Have shown clear value in the past
- But haven’t purchased recently
- Are one step away from churning completely
Recommended actions:
- Targeted win-back campaigns
- Personalized offers (not blanket discounts)
- Reminder emails tied to past purchase behavior
Winning back an existing customer is almost always cheaper than acquiring a new one.
3. Don’t Over-Invest in Truly Lost Customers
Some customers will inevitably churn. RFM helps NovaShop identify those customers early and avoid spending ad budget, discounts and marketing effort on users who are unlikely to return. This isn’t about being cold — it’s about being efficient.
4. Use RFM as a Living Framework, Not a One-Off Analysis
The real power of RFM comes when it’s:
- Recomputed monthly or quarterly
- Integrated into dashboards
- Used to track movement between segments over time
For NovaShop, this means asking questions like:
- How many At-Risk customers became Loyal this month?
- Are Champions increasing or shrinking?
- Which campaigns actually move customers up the ladder?
RFM turns customer behaviour into something measurable and trackable.
Final Thoughts: Closing the EDA in Public Series
When I started this EDA in Public series, I wasn’t trying to build the perfect analysis or demonstrate advanced techniques. I wanted to slow down and share how I actually think when working with real data. Not the polished version, but the messy, iterative process that usually stays hidden.
This project began with a noisy CSV and a lot of open questions. Along the way, there were small issues that only surfaced once I paid closer attention — dates stored as strings, assumptions that didn’t quite hold up, metrics that needed context before they made sense. Working through those moments in public was uncomfortable at times, but also genuinely valuable. Each correction made the analysis stronger and more honest.
One thing this process reinforced for me is that most meaningful insights don’t come from complexity. They come from slowing down, structuring the data properly, and asking better questions. By the time I reached the RFM analysis, the value wasn’t in the formulas themselves — it was in what they forced me to confront. A customer who spent a lot once isn’t necessarily valuable today. Recency matters. Frequency matters. And none of these metrics mean much in isolation.
Ending the series with RFM felt deliberate. It sits at the point where technical work meets business thinking, where tables turn into conversations and numbers turn into decisions. It’s also where exploratory analysis stops being purely descriptive and starts becoming practical. At that stage, the goal is no longer just to understand the data, but to decide what to do next.
Doing this work in public changed how I approach analysis. Writing things out forced me to explain my reasoning, question my assumptions, and be comfortable showing imperfect work. It reminded me that EDA isn’t a checklist you rush through — it’s a dialogue with the data. Sharing that dialogue makes you more thoughtful and more accountable.
This may be the final part of the EDA in Public series, but it doesn’t feel like an endpoint. Everything here could evolve into dashboards, automated pipelines, or deeper customer analysis.
And if you’re a founder, analyst, or team working with customer or sales data and trying to make sense of it, this kind of exploratory work is often where the biggest clarity comes from. These are exactly the kinds of problems I enjoy working through — slowly, thoughtfully, and with the business context in mind.
If you’re documenting your own analyses, I’d love to see how you approach it. And if you’re wrestling with similar questions in your data and want to talk through them, feel free to reach out on any of the platforms below. Good data conversations usually start there.
Thanks for following along!
Medium
LinkedIn
Twitter
YouTube
Register Now to Continue Reading
Unlock Towards Data Science with a Free Account
All articles on Towards Data Science are available to registered users. Create a free account today to access this article and thousands more.
Register for freeSign in to your account
 Written By
See all from Ibrahim Salami
Deep DivesExploratory Data AnalysisMachine LearningPandasPython
Share This Article
Towards Data Science is a community publication. Submit your insights to reach our global audience and earn through the TDS Author Payment Program.
Write for TDS
Related Articles
Machine Learning
Xin Yu, Yingyuan (Valerie) Zhang, Yutong (Grace) Zhu
Yingyuan (Valerie) Zhang
October 12, 20205 min read
Artificial Intelligence
This article gives an introduction to vectors, vector operations and their application in the field of data science.
Deniz Tuzsus
November 25, 20215 min read
Machine Learning
Build an ML model using SQL on Google Big Query
Anuj Syal
November 12, 20215 min read
Deep Learning
Learn why you should build demos for your Machine Learning models in 2022
Nicolas Jaccard
January 18, 202212 min read
Artificial Intelligence
Optimize the Embedding Space for Improving RAG
Iulia Brezeanu
January 27, 20248 min read
Programming
Enhance your Data Science skills in Python with the Pandas API.
Dan Root
October 30, 20201 min read
NLP
A code tutorial on detecting drift in text data
Elena Samuylova
February 20, 202313 min read
Artificial Intelligence
Learn about model interpretation techniques, limitations and advances
Dipanjan (DJ) Sarkar
October 31, 201821 min read
Artificial Intelligence
Achieving optimal throughput and latency with model inference on high client-server traffic
Tan Pengshi Alvin
December 15, 20226 min read
Your home for data science and AI. The world's leading publication for data science, data analytics, data engineering, machine learning, and artificial intelligence professionals.
Subscribe to Our NewsletterWrite For TDS•About•Advertise•Privacy Policy•Terms of Use
© Insight Media Group, LLC 2026•The New Stack•roadmap.sh•Creator Network
Recommended Articles
Close