保留正文与补采附件。源页面当前未重新核验;具体限制见交付清单。
 We value your privacy
We use cookies to enhance your browsing experience, serve personalised ads or content, and analyse our traffic. By clicking "Accept All", you consent to our use of cookies.
Customise Reject All Accept All
Customise Consent Preferences
 We use cookies to help you navigate efficiently and perform certain functions. You will find detailed information about all cookies under each consent category below.
The cookies that are categorised as "Necessary" are stored on your browser as they are essential for enabling the basic functionalities of the site. ... Show more
NecessaryAlways Active
Necessary cookies are required to enable the basic features of this site, such as providing secure log-in or adjusting your consent preferences. These cookies do not store any personally identifiable data.
-
Cookie
BCTempID
-
Duration
10 minutes
-
Description
No description available.
-
Cookie
__cf_bm
-
Duration
1 hour
-
Description
This cookie, set by Cloudflare, is used to support Cloudflare Bot Management.
-
Cookie
AWSALBCORS
-
Duration
7 days
-
Description
Amazon Web Services set this cookie for load balancing.
-
Cookie
_cfuvid
-
Duration
session
-
Description
Cloudflare sets this cookie to track users across sessions to optimize user experience by maintaining session consistency and providing personalized services
-
Cookie
li_gc
-
Duration
6 months
-
Description
Linkedin set this cookie for storing visitor's consent regarding using cookies for non-essential purposes.
-
Cookie
__hssrc
-
Duration
session
-
Description
This cookie is set by Hubspot whenever it changes the session cookie. The __hssrc cookie set to 1 indicates that the user has restarted the browser, and if the cookie does not exist, it is assumed to be a new session.
-
Cookie
__hssc
-
Duration
1 hour
-
Description
HubSpot sets this cookie to keep track of sessions and to determine if HubSpot should increment the session number and timestamps in the __hstc cookie.
-
Cookie
wpEmojiSettingsSupports
-
Duration
session
-
Description
WordPress sets this cookie when a user interacts with emojis on a WordPress site. It helps determine if the user's browser can display emojis properly.
-
Cookie
BCSessionID
-
Duration
1 year 1 month 4 days
-
Description
Blueconic sets this cookie as a unique identifier for the BlueConic profile.
-
Cookie
_octo
-
Duration
1 year
-
Description
No description available.
-
Cookie
logged_in
-
Duration
1 year
-
Description
No description available.
-
Cookie
__Secure-YEC
-
Duration
past
-
Description
YouTube sets this cookie to stores the user's video player preferences using embedded YouTube video
-
Cookie
__eoi
-
Duration
6 months
-
Description
Description is currently not available.
-
Cookie
AWSALBTGCORS
-
Duration
7 days
-
Description
No description available.
-
Cookie
login-status-p
-
Duration
past
-
Description
Description is currently not available.
-
Cookie
AWSALBTG
-
Duration
7 days
-
Description
No description available.
-
Cookie
csrf_token
-
Duration
session
-
Description
No description available.
-
Cookie
token_v2
-
Duration
1 day
-
Description
Description is currently not available.
-
Cookie
D
-
Duration
1 year
-
Description
Description is currently not available.
-
Cookie
PHPSESSID
-
Duration
session
-
Description
This cookie is native to PHP applications. The cookie stores and identifies a user's unique session ID to manage user sessions on the website. The cookie is a session cookie and will be deleted when all the browser windows are closed.
-
Cookie
VISITOR_PRIVACY_METADATA
-
Duration
6 months
-
Description
YouTube sets this cookie to store the user's cookie consent state for the current domain.
-
Cookie
cookietest
-
Duration
session
-
Description
The cookietest cookie is typically used to determine whether the user's browser accepts cookies, essential for website functionality and user experience.
-
Cookie
__Host-airtable-session
-
Duration
1 year
-
Description
This cookie is used to enable us to integrate the services of Airtable.
-
Cookie
__Host-airtable-session.sig
-
Duration
1 year
-
Description
This cookie is used to enable us to integrate the services of Airtable.
-
Cookie
m
-
Duration
1 year 1 month 4 days
-
Description
Stripe sets this cookie for fraud prevention purposes. It identifies the device used to access the website, allowing the website to be formatted accordingly.
-
Cookie
BIGipServer*
-
Duration
session
-
Description
Marketo sets this cookie to collect information about the user's online activity and build a profile about their interests to provide advertisements relevant to the user.
-
Cookie
__cfruid
-
Duration
session
-
Description
Cloudflare sets this cookie to identify trusted web traffic.
-
Cookie
_GRECAPTCHA
-
Duration
6 months
-
Description
Google Recaptcha service sets this cookie to identify bots to protect the website against malicious spam attacks.
-
Cookie
__Secure-YNID
-
Duration
6 months
-
Description
Google cookie used to protect user security and prevent fraud, especially during the login process.
-
Cookie
cookieyes-consent
-
Duration
1 year
-
Description
CookieYes sets this cookie to remember users' consent preferences so that their preferences are respected on subsequent visits to this site. It does not collect or store any personal information about the site visitors.
Functional
Functional cookies help perform certain functionalities like sharing the content of the website on social media platforms, collecting feedback, and other third-party features.
-
Cookie
lidc
-
Duration
1 day
-
Description
LinkedIn sets the lidc cookie to facilitate data center selection.
-
Cookie
brw
-
Duration
1 year
-
Description
No description available.
-
Cookie
brwConsent
-
Duration
5 minutes
-
Description
Description is currently not available.
-
Cookie
WMF-Uniq
-
Duration
1 year
-
Description
Description is currently not available.
-
Cookie
loom_anon_comment
-
Duration
1 year
-
Description
No description available.
-
Cookie
loom_referral_video
-
Duration
session
-
Description
Description is currently not available.
-
Cookie
VISITOR_INFO1_LIVE
-
Duration
6 months
-
Description
A cookie set by YouTube to measure bandwidth that determines whether the user gets the new or old player interface.
-
Cookie
yt-remote-connected-devices
-
Duration
Never Expires
-
Description
YouTube sets this cookie to store the user's video preferences using embedded YouTube videos.
-
Cookie
ytidb::LAST_RESULT_ENTRY_KEY
-
Duration
Never Expires
-
Description
The cookie ytidb::LAST_RESULT_ENTRY_KEY is used by YouTube to store the last search result entry that was clicked by the user. This information is used to improve the user experience by providing more relevant search results in the future.
-
Cookie
yt-remote-device-id
-
Duration
Never Expires
-
Description
YouTube sets this cookie to store the user's video preferences using embedded YouTube videos.
-
Cookie
yt-remote-session-name
-
Duration
session
-
Description
The yt-remote-session-name cookie is used by YouTube to store the user's video player preferences using embedded YouTube video.
-
Cookie
yt-remote-fast-check-period
-
Duration
session
-
Description
The yt-remote-fast-check-period cookie is used by YouTube to store the user's video player preferences for embedded YouTube videos.
-
Cookie
yt-remote-session-app
-
Duration
session
-
Description
The yt-remote-session-app cookie is used by YouTube to store user preferences and information about the interface of the embedded YouTube video player.
-
Cookie
yt-remote-cast-available
-
Duration
session
-
Description
The yt-remote-cast-available cookie is used to store the user's preferences regarding whether casting is available on their YouTube video player.
-
Cookie
yt-remote-cast-installed
-
Duration
session
-
Description
The yt-remote-cast-installed cookie is used to store the user's video player preferences using embedded YouTube video.
-
Cookie
cp_session
-
Duration
3 months
-
Description
Codepen sets this cookie for Help systems found in the website.
-
Cookie
loid
-
Duration
1 year 1 month 4 days
-
Description
This cookie is set by the Reddit. The cookie enables the sharing of content from the website onto the social media platform.
Analytics
Analytical cookies are used to understand how visitors interact with the website. These cookies help provide information on metrics such as the number of visitors, bounce rate, traffic source, etc.
-
Cookie
__hstc
-
Duration
6 months
-
Description
Hubspot set this main cookie for tracking visitors. It contains the domain, initial timestamp (first visit), last timestamp (last visit), current timestamp (this visit), and session number (increments for each subsequent session).
-
Cookie
hubspotutk
-
Duration
6 months
-
Description
HubSpot sets this cookie to keep track of the visitors to the website. This cookie is passed to HubSpot on form submission and used when deduplicating contacts.
-
Cookie
_ga
-
Duration
1 year 1 month 4 days
-
Description
Google Analytics sets this cookie to calculate visitor, session and campaign data and track site usage for the site's analytics report. The cookie stores information anonymously and assigns a randomly generated number to recognise unique visitors.
-
Cookie
ga*
-
Duration
1 year 1 month 4 days
-
Description
Google Analytics sets this cookie to store and count page views.
-
Cookie
__Host-psifi.analyticsTrace
-
Duration
6 hours
-
Description
Description is currently not available.
-
Cookie
__Host-psifi.analyticsTraceV2
-
Duration
6 hours
-
Description
Description is currently not available.
-
Cookie
_gh_sess
-
Duration
session
-
Description
GitHub sets this cookie for temporary application and framework state between pages like what step the user is on in a multiple step form.
-
Cookie
YSC
-
Duration
session
-
Description
YSC cookie is set by Youtube and is used to track the views of embedded videos on Youtube pages.
-
Cookie
ajs_anonymous_id
-
Duration
1 year
-
Description
This cookie is set by Segment to count the number of people who visit a certain site by tracking if they have visited before.
-
Cookie
vuid
-
Duration
1 year 1 month 4 days
-
Description
Vimeo installs this cookie to collect tracking information by setting a unique ID to embed videos on the website.
Performance
Performance cookies are used to understand and analyse the key performance indexes of the website which helps in delivering a better user experience for the visitors.
-
Cookie
AWSALB
-
Duration
7 days
-
Description
AWSALB is an application load balancer cookie set by Amazon Web Services to map the session to the target.
-
Cookie
acq
-
Duration
past
-
Description
Description is currently not available.
-
Cookie
acq.sig
-
Duration
past
-
Description
Description is currently not available.
-
Cookie
ptc
-
Duration
2 years
-
Description
No description available.
Advertisement
Advertisement cookies are used to provide visitors with customised advertisements based on the pages you visited previously and to analyse the effectiveness of the ad campaigns.
-
Cookie
muc_ads
-
Duration
1 year 1 month 4 days
-
Description
Twitter sets this cookie to collect user behaviour and interaction data to optimize the website.
-
Cookie
guest_id_marketing
-
Duration
1 year 1 month 4 days
-
Description
Twitter sets this cookie to identify and track the website visitor.
-
Cookie
guest_id_ads
-
Duration
1 year 1 month 4 days
-
Description
Twitter sets this cookie to identify and track the website visitor.
-
Cookie
personalization_id
-
Duration
1 year 1 month 4 days
-
Description
Twitter sets this cookie to integrate and share features for social media and also store information about how the user uses the website, for tracking and targeting.
-
Cookie
guest_id
-
Duration
1 year 1 month 4 days
-
Description
Twitter sets this cookie to identify and track the website visitor. It registers if a user is signed in to the Twitter platform and collects information about ad preferences.
-
Cookie
bcookie
-
Duration
1 year
-
Description
LinkedIn sets this cookie from LinkedIn share buttons and ad tags to recognize browser IDs.
-
Cookie
__Secure-ROLLOUT_TOKEN
-
Duration
6 months
-
Description
YouTube sets this cookie to manage feature rollout and experimentation. It helps Google control which new features or interface changes are shown to users as part of testing and staged rollouts, ensuring consistent experience for a given user during an experiment.
-
Cookie
yt.innertube::nextId
-
Duration
Never Expires
-
Description
YouTube sets this cookie to register a unique ID to store data on what videos from YouTube the user has seen.
-
Cookie
yt.innertube::requests
-
Duration
Never Expires
-
Description
YouTube sets this cookie to register a unique ID to store data on what videos from YouTube the user has seen.
-
Cookie
session_tracker
-
Duration
session
-
Description
This cookie is set by the Reddit. This cookie is used to identify trusted web traffic. It also helps in adverstising on the website.
-
Cookie
edgebucket
-
Duration
session
-
Description
Reddit sets this cookie to save the information about a log-on Reddit user, for the purpose of advertisement recommendations and updating the content.
-
Cookie
did
-
Duration
1 year
-
Description
Arbor sets this cookie to show targeted ads to site visitors.This cookie expires after 2 months or 1 year.
Uncategorised
Other uncategorised cookies are those that are being analysed and have not been classified into a category as yet.
No cookies to display.
Reject All Save My Preferences Accept All
Toggle SearchToggle Mobile Navigation
Publish AI, ML & data-science insights to a global community of data professionals.
Sign inSubmit an Article
LatestEditor's PicksNewsletterShipAI
Write For TDS
LinkedInXToggle Search
Data Science
When Predictors Collide: Mastering VIF in Multicollinear Regression
Explore how the Variance Inflation Factor helps detect and manage multicollinearity in your regression models.
Niklas Lang
April 16, 20259 min read
 Photo by MARIOLA GROBELSKA via Unsplash
In regression models, the independent variables must be not or only slightly dependent on each other, i.e. that they are not correlated. However, if such a dependency exists, this is referred to as multicollinearity and leads to unstable models and results that are difficult to interpret. The variance inflation factor is a decisive metric for recognizing multicollinearity and indicates the extent to which the correlation with other predictors increases the variance of a regression coefficient. A high value of this metric indicates a high correlation of the variable with other independent variables in the model.
In the following article, we look in detail at multicollinearity and the VIF as a measurement tool. We also show how the VIF can be interpreted and what measures can be taken to reduce it. We also compare the indicator with other methods for measuring multicollinearity.
What is Multicollinearity?
Multicollinearity is a phenomenon that occurs in regression analysis when two or more variables are strongly correlated with each other so that a change in one variable leads to a change in the other variable. As a result, the development of an independent variable can be predicted completely or at least partially by another variable. This complicates the prediction of linear regression to determine the influence of an independent variable on the dependent variable.
A distinction can be made between two types of multicollinearity:
Learn this step by step with the interactive AI and Data Scientist roadmap.
- Perfect Multicollinearity : a variable is an exact linear combination of another variable, for example when two variables measure the same thing in different units, such as weight in kilograms and pounds.
- High Degree of Multicollinearity : Here, one variable is strongly, but not completely, explained by at least one other variable. For example, there is a high correlation between a person's education and their income, but it is not perfect multicollinearity.
The occurrence of multicollinearity in regressions leads to serious problems as, for example, the regression coefficients become unstable and react very strongly to new data, so that the overall prediction quality suffers. Various methods can be used to recognize multicollinearity, such as the correlation matrix or the variance inflation factor, which we will look at in more detail in the next section.
What is the Variance Inflation Factor (VIF)?
The variance inflation factor (VIF) describes a diagnostic tool for regression models that helps to detect multicollinearity. It indicates the factor by which the variance of a coefficient increases due to the correlation with other variables. A high VIF value indicates a strong multicollinearity of the variable with other independent variables. This negatively influences the regression coefficient estimate and results in high standard errors. It is therefore important to calculate the VIF so that multicollinearity is recognized at an early stage and countermeasures can be taken. The VIF for a single variable iii is calculated using this formula:
[latex] \[VIF = \frac{1}{(1 - R^2)}\]
Here R2R^2R2 is the so-called coefficient of determination of the regression of feature iii against all other independent variables. A high R2R^2R2 value indicates that a large proportion of the variables can be explained by the other features, so that multicollinearity is suspected.
In a regression with the three independent variables X1X_1X1, X2X_2X2 and X3X_3X3, for example, one would train a regression with X1X_1X1 as the dependent variable and X2X_2X2 and X3X_3X3 as independent variables. With the help of this model, R12R_{1}^2R12 could then be calculated and inserted into the formula for the VIF. This procedure would then be repeated for the remaining combinations of the three independent variables.
A typical threshold value is VIF > 10, which indicates strong multicollinearity. In the following section, we look in more detail at the interpretation of the variance inflation factor.
How can different Values of the Variance Inflation Factor be interpreted?
After calculating the VIF, it is important to be able to evaluate what statement the value makes about the situation in the model and to be able to deduce whether measures are necessary. The values can be interpreted as follows:
- VIF = 1 : This value indicates that there is no multicollinearity between the analyzed variable and the other variables. This means that no further action is required.
- VIF between 1 and 5 : If the value is in the range between 1 and 5, then there is multicollinearity between the variables, but this is not large enough to represent an actual problem. Rather, the dependency is still moderate enough that it can be absorbed by the model itself.
- VIF > 5: In such a case, there is already a high degree of multicollinearity, which requires intervention in any case. The standard error of the predictor is likely to be significantly excessive, so the regression coefficient may be unreliable. Consideration should be given to combining the correlated predictors into one variable.
- VIF > 10: With such a value, the variable has serious multicollinearity and the regression model is very likely to be unstable. In this case, consideration should be given to removing the variable to obtain a more powerful model.
Overall, a high VIF value indicates that the variable may be redundant, as it is highly correlated with other variables. In such cases, various measures should be taken to reduce multicollinearity.
What measures help to reduce the VIF?
There are various ways to circumvent the effects of multicollinearity and thus also reduce the variance inflation factor. The most popular measures include:
- Removing highly correlated variables : Especially with a high VIF value, removing individual variables with high multicollinearity is a good tool. This can improve the results of the regression, as redundant variables estimate the coefficients more unstable.
- Principal component analysis (PCA): The core idea of principal component analysis is that several variables in a data set may measure the same thing, i.e. be correlated. This means that the various dimensions can be combined into fewer so-called principal components without compromising the significance of the data set. Height, for example, is highly correlated with shoe size, as tall people often have taller shoes and vice versa. This means that the correlated variables are then combined into uncorrelated main components, which reduces multicollinearity without losing important information. However, this is also accompanied by a loss of interpretability, as the principal components do not represent real characteristics, but a combination of different variables.
- Regularization Methods : Regularization comprises various methods that are used in statistics and machine learning to control the complexity of a model. It helps to react robustly to new and unseen data and thus enables the generalizability of the model. This is achieved by adding a penalty term to the model's optimization function to prevent the model from adapting too much to the training data. This approach reduces the influence of highly correlated variables and lowers the VIF. At the same time, however, the accuracy of the model is not affected.
These methods can be used to effectively reduce the VIF and combat multicollinearity in a regression. This makes the results of the model more stable and the standard error can be better controlled.
How does the VIF compare to other methods?
The variance inflation factor is a widely used technique to measure multicollinearity in a data set. However, other methods can offer specific advantages and disadvantages compared to the VIF, depending on the application.
Correlation Matrix
The correlation matrix is a statistical method for quantifying and comparing the relationships between different variables in a data set. The pairwise correlations between all combinations of two variables are shown in a tabular structure. Each cell in the matrix contains the so-called correlation coefficient between the two variables defined in the column and the row.
This value can be between -1 and 1 and provides information on how the two variables relate to each other. A positive value indicates a positive correlation, meaning that an increase in one variable leads to an increase in the other variable. The exact value of the correlation coefficient provides information on how strongly the variables move about each other. With a negative correlation coefficient, the variables move in opposite directions, meaning that an increase in one variable leads to a decrease in the other variable. Finally, a coefficient of 0 indicates that there is no correlation.
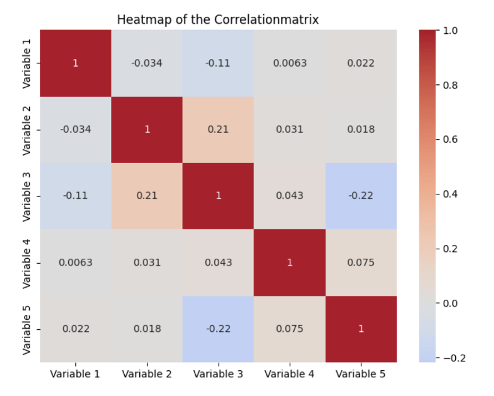 Example of a Correlation Matrix | Source: Author
A correlation matrix therefore fulfills the purpose of presenting the correlations in a data set in a quick and easy-to-understand way and thus forms the basis for subsequent steps, such as model selection. This makes it possible, for example, to recognize multicollinearity, which can cause problems with regression models, as the parameters to be learned are distorted.
Compared to the VIF, the correlation matrix only offers a surface analysis of the correlations between variables. However, the biggest difference is that the correlation matrix only shows the pairwise comparisons between variables and not the simultaneous effects between several variables. In addition, the VIF is more useful for quantifying exactly how much multicollinearity affects the estimate of the coefficients.
Eigenvalue Decomposition
Eigenvalue decomposition is a method that builds on the correlation matrix and mathematically helps to identify multicollinearity. Either the correlation matrix or the covariance matrix can be used. In general, small eigenvalues indicate a stronger, linear dependency between the variables and are therefore a sign of multicollinearity.
Compared to the VIF, the eigenvalue decomposition offers a deeper mathematical analysis and can in some cases also help to detect multicollinearity that would have remained hidden by the VIF. However, this method is much more complex and difficult to interpret.
The VIF is a simple and easy-to-understand method for detecting multicollinearity. Compared to other methods, it performs well because it allows a precise and direct analysis that is at the level of the individual variables.
How to detect Multicollinearity in Python?
Recognizing multicollinearity is a crucial step in data preprocessing in machine learning to train a model that is as meaningful and robust as possible. In this section, we therefore take a closer look at how the VIF can be calculated in Python and how the correlation matrix is created.
Calculating the Variance Inflation Factor in Python
The variance inflation factor can be easily used and imported in Python via the statsmodels library. Assuming we already have a Pandas DataFrame in a variable X that contains the independent variables, we can simply create a new, empty DataFrame for calculating the VIFs. The variable names and values are then saved in this frame.
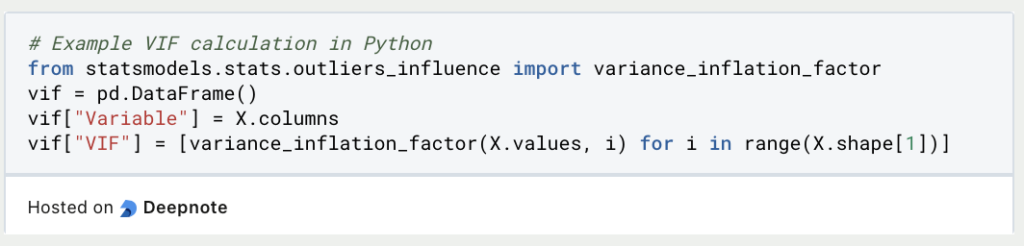 A new row is created for each independent variable in
X in the Variable column. It is then iterated through all variables in the data set and the variance inflation factor is calculated for the values of the variables and again saved in a list. This list is then stored as column VIF in the DataFrame.
Calculating the Correlation Matrix
In Python, a correlation matrix can be easily calculated using Pandas and then visualized as a heatmap using Seaborn. To illustrate this, we generate random data using NumPy and store it in a DataFrame. As soon as the data is stored in a DataFrame, the correlation matrix can be created using the corr() function.
If no parameters are defined within the function, the Pearson coefficient is used by default to calculate the correlation matrix. Otherwise, you can also define a different correlation coefficient using the method parameter.
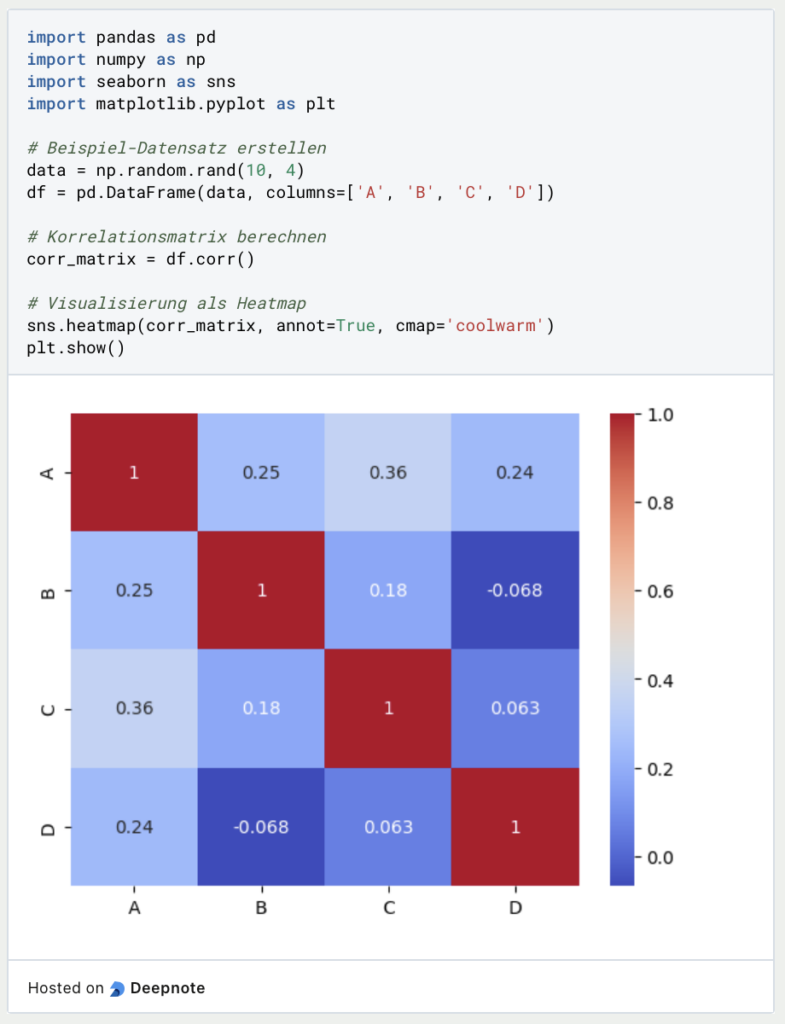 Finally, the heatmap is visualized using
seaborn. To do this, the heatmap() function is called and the correlation matrix is passed. Among other things, the parameters can be used to determine whether the labels should be added and the color palette can be specified. The diagram is then displayed with the help of matplolib.
This is what you should take with you
- The variance inflation factor is a key indicator for recognizing multicollinearity in a regression model.
- The coefficient of determination of the independent variables is used for the calculation. Not only the correlation between two variables can be measured, but also combinations of variables.
- In general, a reaction should be taken if the VIF is greater than five, and appropriate measures should be introduced. For example, the affected variables can be removed from the data set or the principal component analysis can be performed.
- In Python, the VIF can be calculated directly using statsmodels. To do this, the data must be stored in a DataFrame. The correlation matrix can also be calculated using Seaborn to detect multicollinearity.
Register Now to Continue Reading
Unlock Towards Data Science with a Free Account
All articles on Towards Data Science are available to registered users. Create a free account today to access this article and thousands more.
Register for freeSign in to your account
 Written By
See all from Niklas Lang
Editor's PicksMulticollinearityPythonStatisticsVariance Inflation Factor
Share This Article
Towards Data Science is a community publication. Submit your insights to reach our global audience and earn through the TDS Author Payment Program.
Write for TDS
Related Articles
Programming
A how-to on GETting and POSTing data to a Flask API
Alexis McKenzie
August 23, 20214 min read
This is the first part of a 4 part tutorial series on web scraping using Scrapy and Selenium.
Karthikeyan P
July 31, 202014 min read
Artificial Intelligence
While the performance of a machine learning model can seem impressive, it might not be making a significant impact to the business unless...
Suhas Maddali
August 3, 20228 min read
Data Science
BallTree function for efficient distance analysis: Bus stops and restaurants
Bryan Vallejo
December 29, 20217 min read
Machine Learning
I take a high-level look at my year of music streaming
Mads Kalør
January 12, 20229 min read
Artificial Intelligence
A Gentle Introduction to LangChain Memory Types
Andrea Valenzuela
August 20, 20239 min read
Machine Learning
Tips to make an impactful resume that stands out
Sharan Kumar Ravindran
April 17, 20217 min read
Machine Learning
Causal AI, exploring the integration of causal reasoning into machine learning
Ryan OSullivan
May 24, 202412 min read
NLP
An Instructional Guide and Flow Diagram for Building a Supervised Machine Learning Text Classifier in Python
Lucy Dickinson
February 17, 202311 min read
Your home for data science and AI. The world's leading publication for data science, data analytics, data engineering, machine learning, and artificial intelligence professionals.
Subscribe to Our NewsletterWrite For TDS•About•Advertise•Privacy Policy•Terms of Use
© Insight Media Group, LLC 2026•The New Stack•roadmap.sh•Creator Network
Recommended Articles
Close